Building Python Data Applications:
with Blaze and Bokeh
SciPy 2015
by Christine Doig
Introduction
About me
E.ON Energy Research Center
About the tutorial
- Goals
- Method
- Setup reminder
- Data
- Slides
Goals
Method
Project driven tutorial
Climate App
Baseball App
Method
Setup reminder (I)
Anaconda: Python + Conda + a bunch of packages
$ conda update conda
$ conda update anaconda
or
Miniconda: Python + Conda +
$ conda env create
$ source activate scipy-tutorial
Setup reminder (II)
$ git clone https://github.com/chdoig/scipy2015-blaze-bokeh.git
$ cd scipy2015-blaze-bokeh
$ ipython notebook
Bokeh version: 0.9.0
Blaze version: 0.8.0
Data
Download:
https://s3.amazonaws.com/scipy-blaze-bokeh/Land_and_Ocean_LatLong1.nc
https://s3.amazonaws.com/scipy-blaze-bokeh/lahman2013.sqlite
Move those datasets to the folder:
~/scipy2015-blaze-bokeh/data
Slides
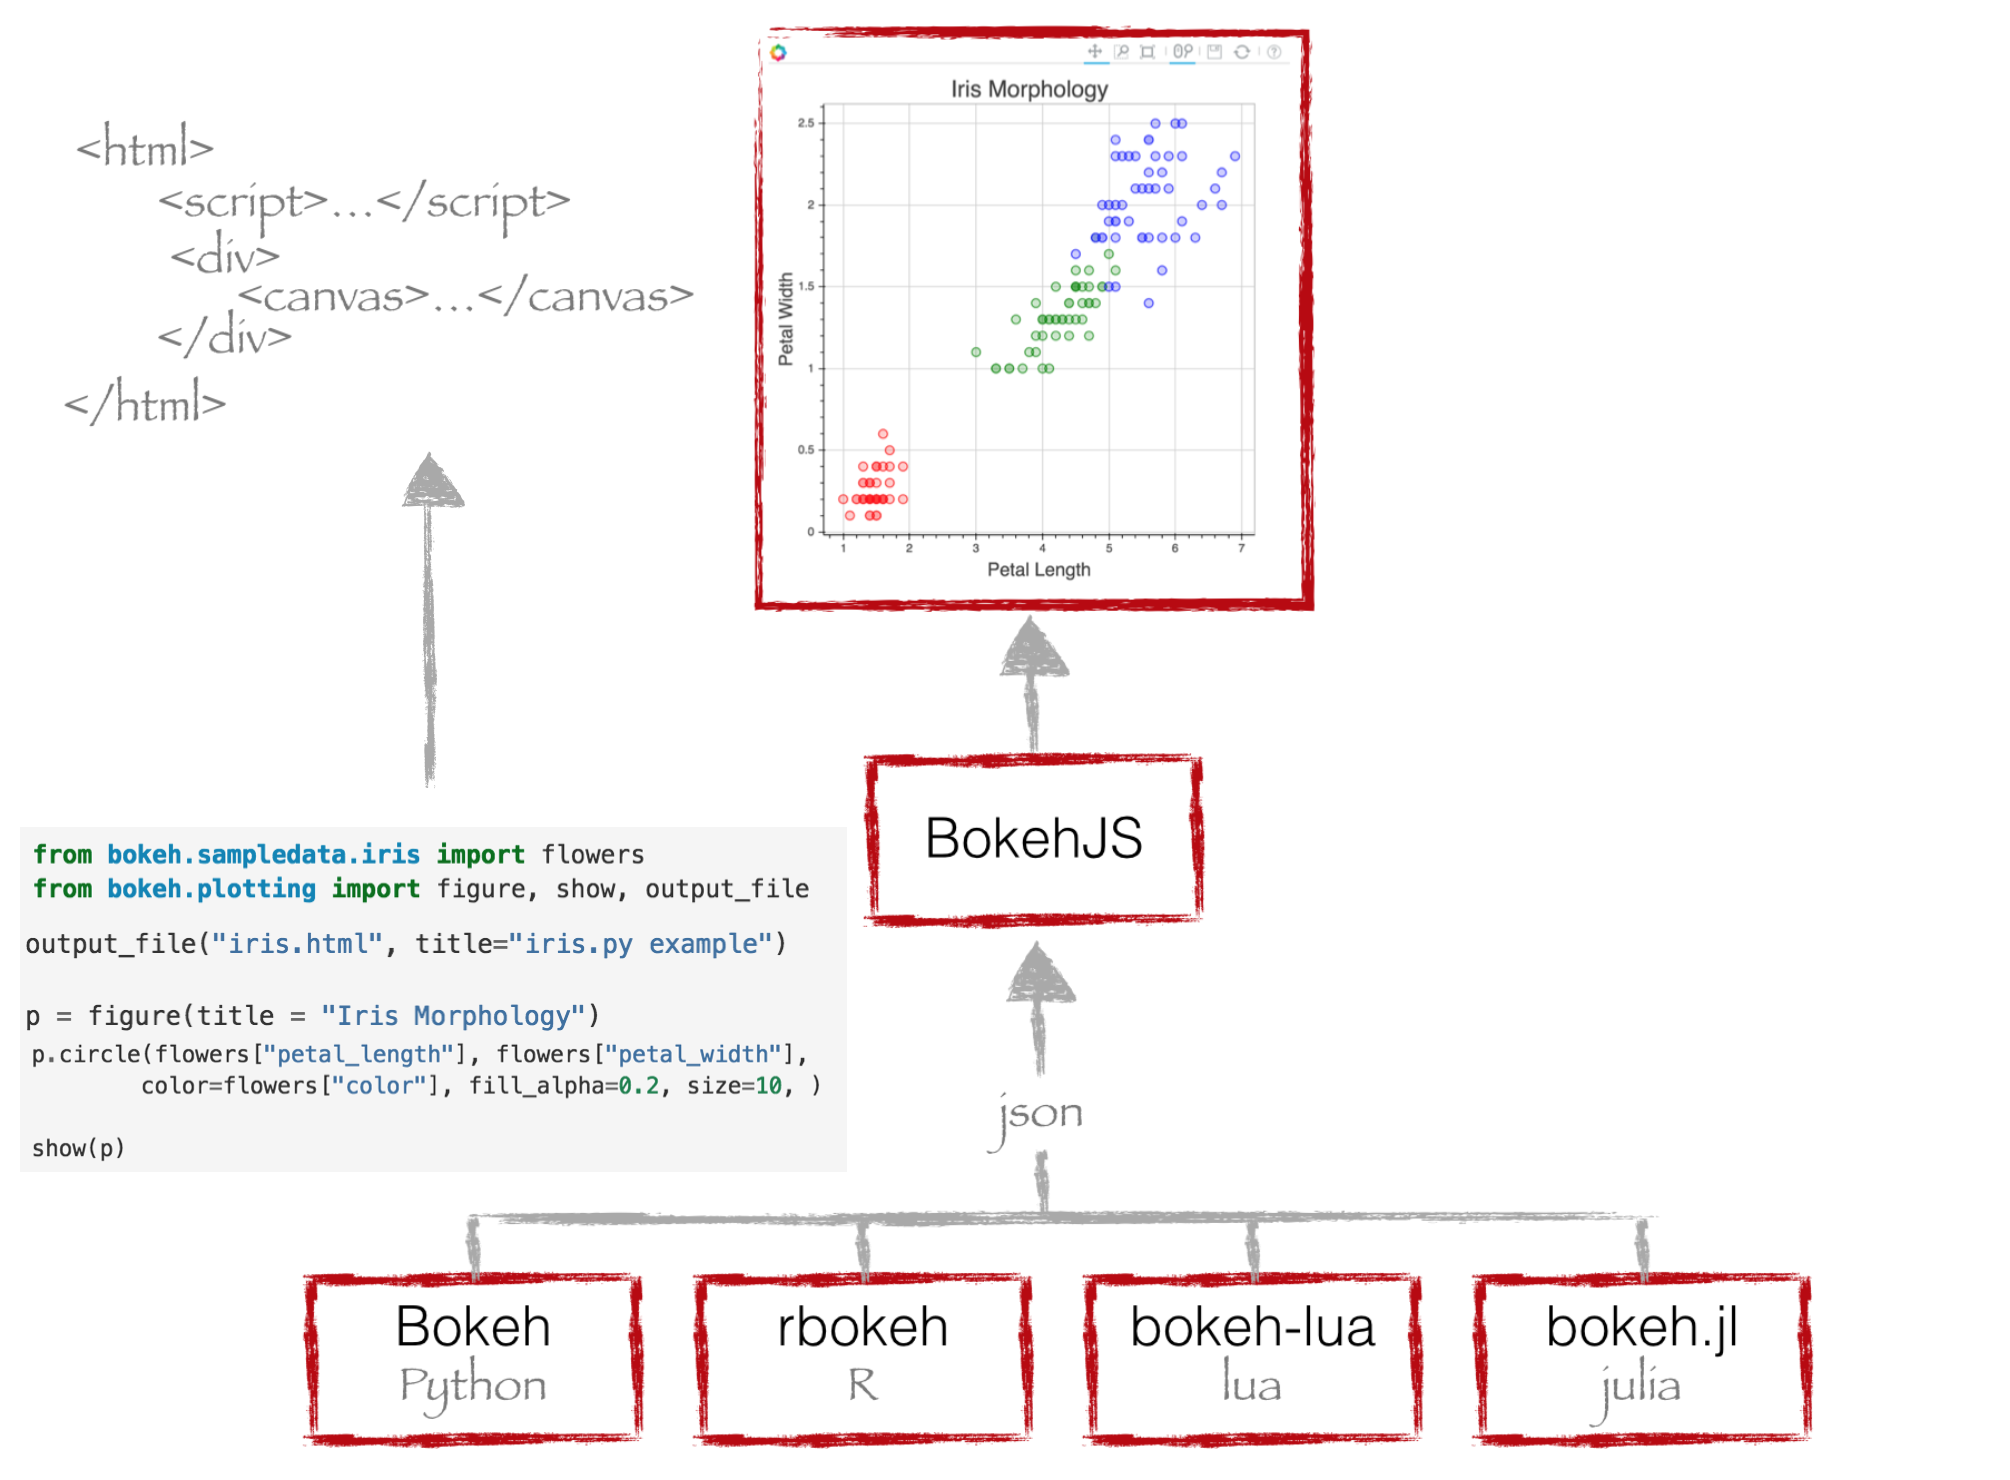
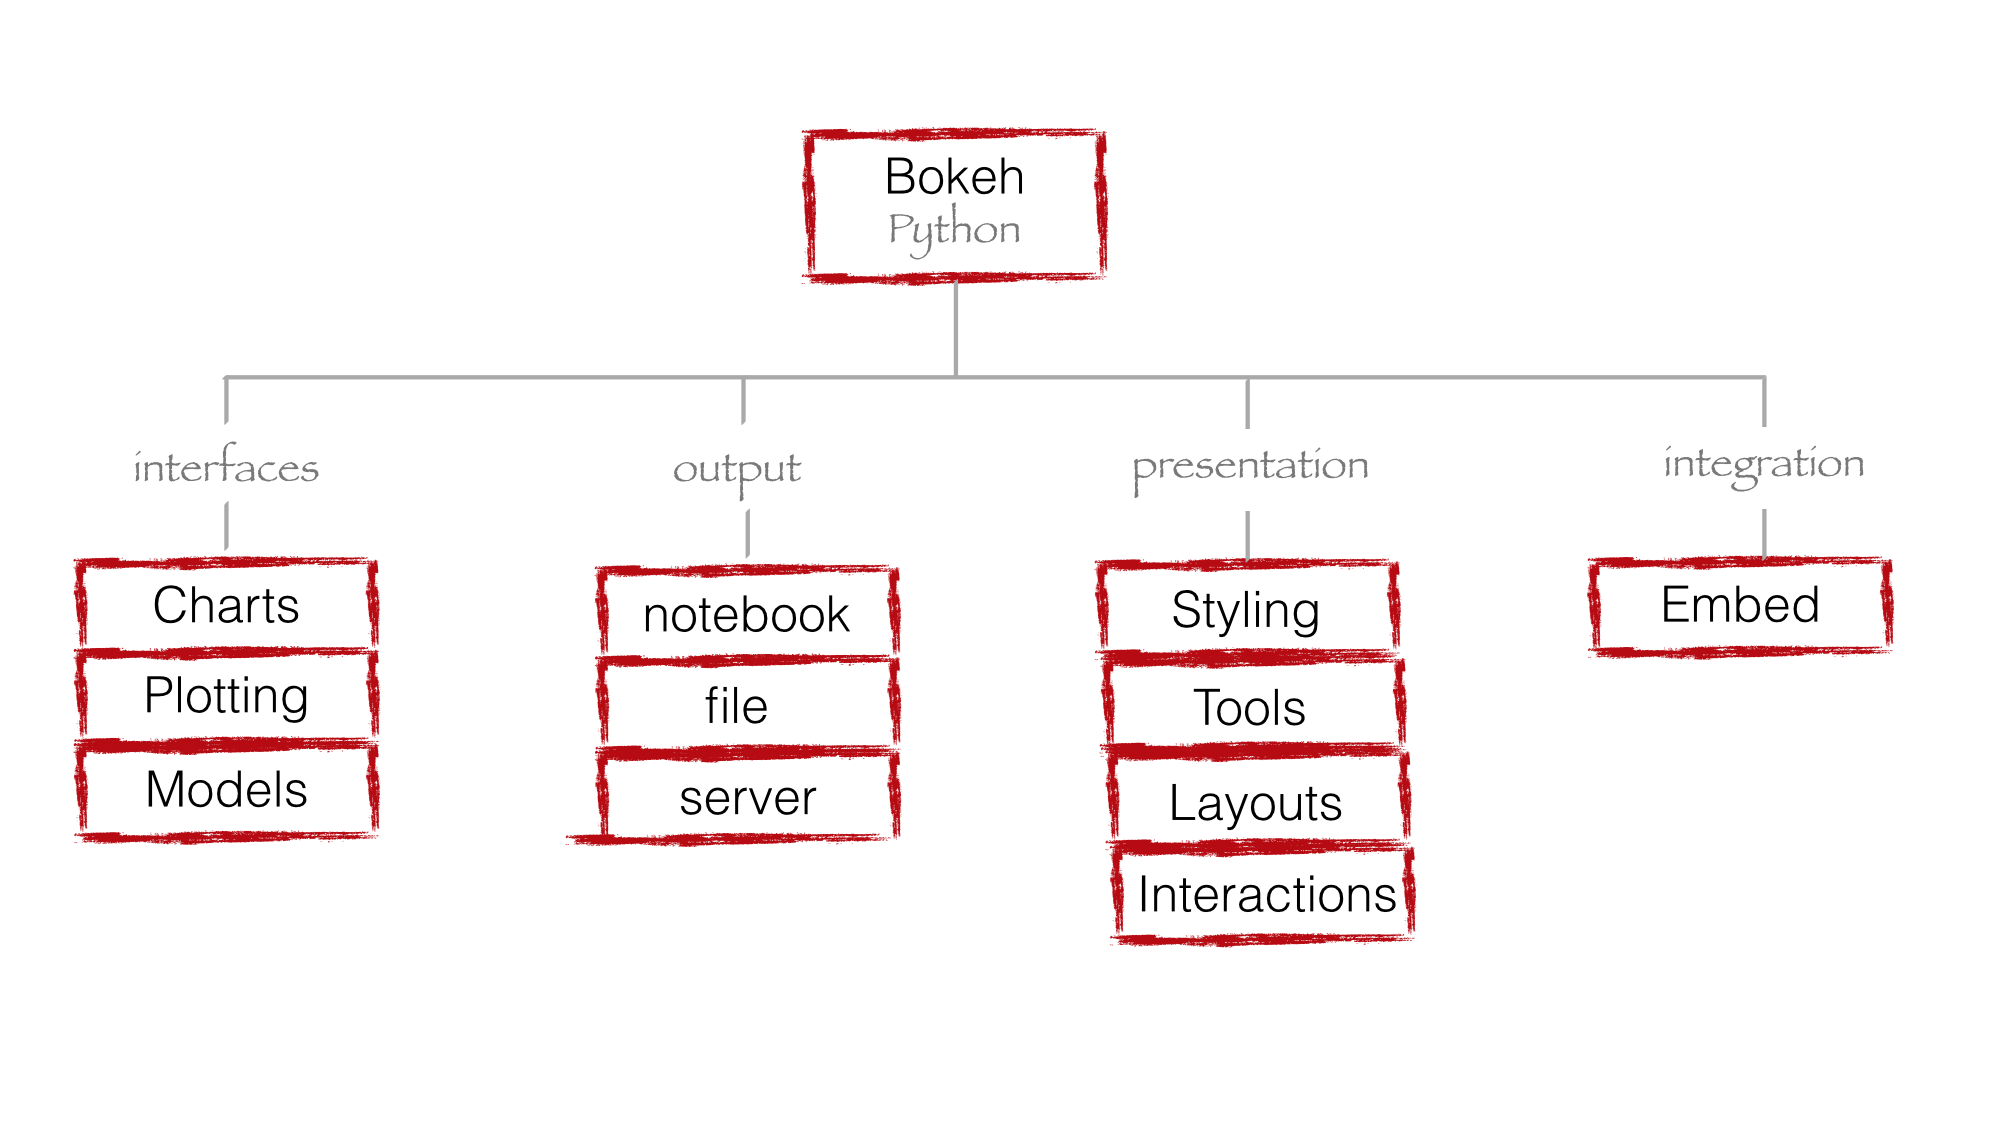
Introduction to Bokeh
About Bokeh

Python interactive visualization library that targets modern web browsers for presentation
http://bokeh.pydata.org/en/latest/
![]() @BokehPlots
@BokehPlots
![]() Bokeh organization
Bokeh organization

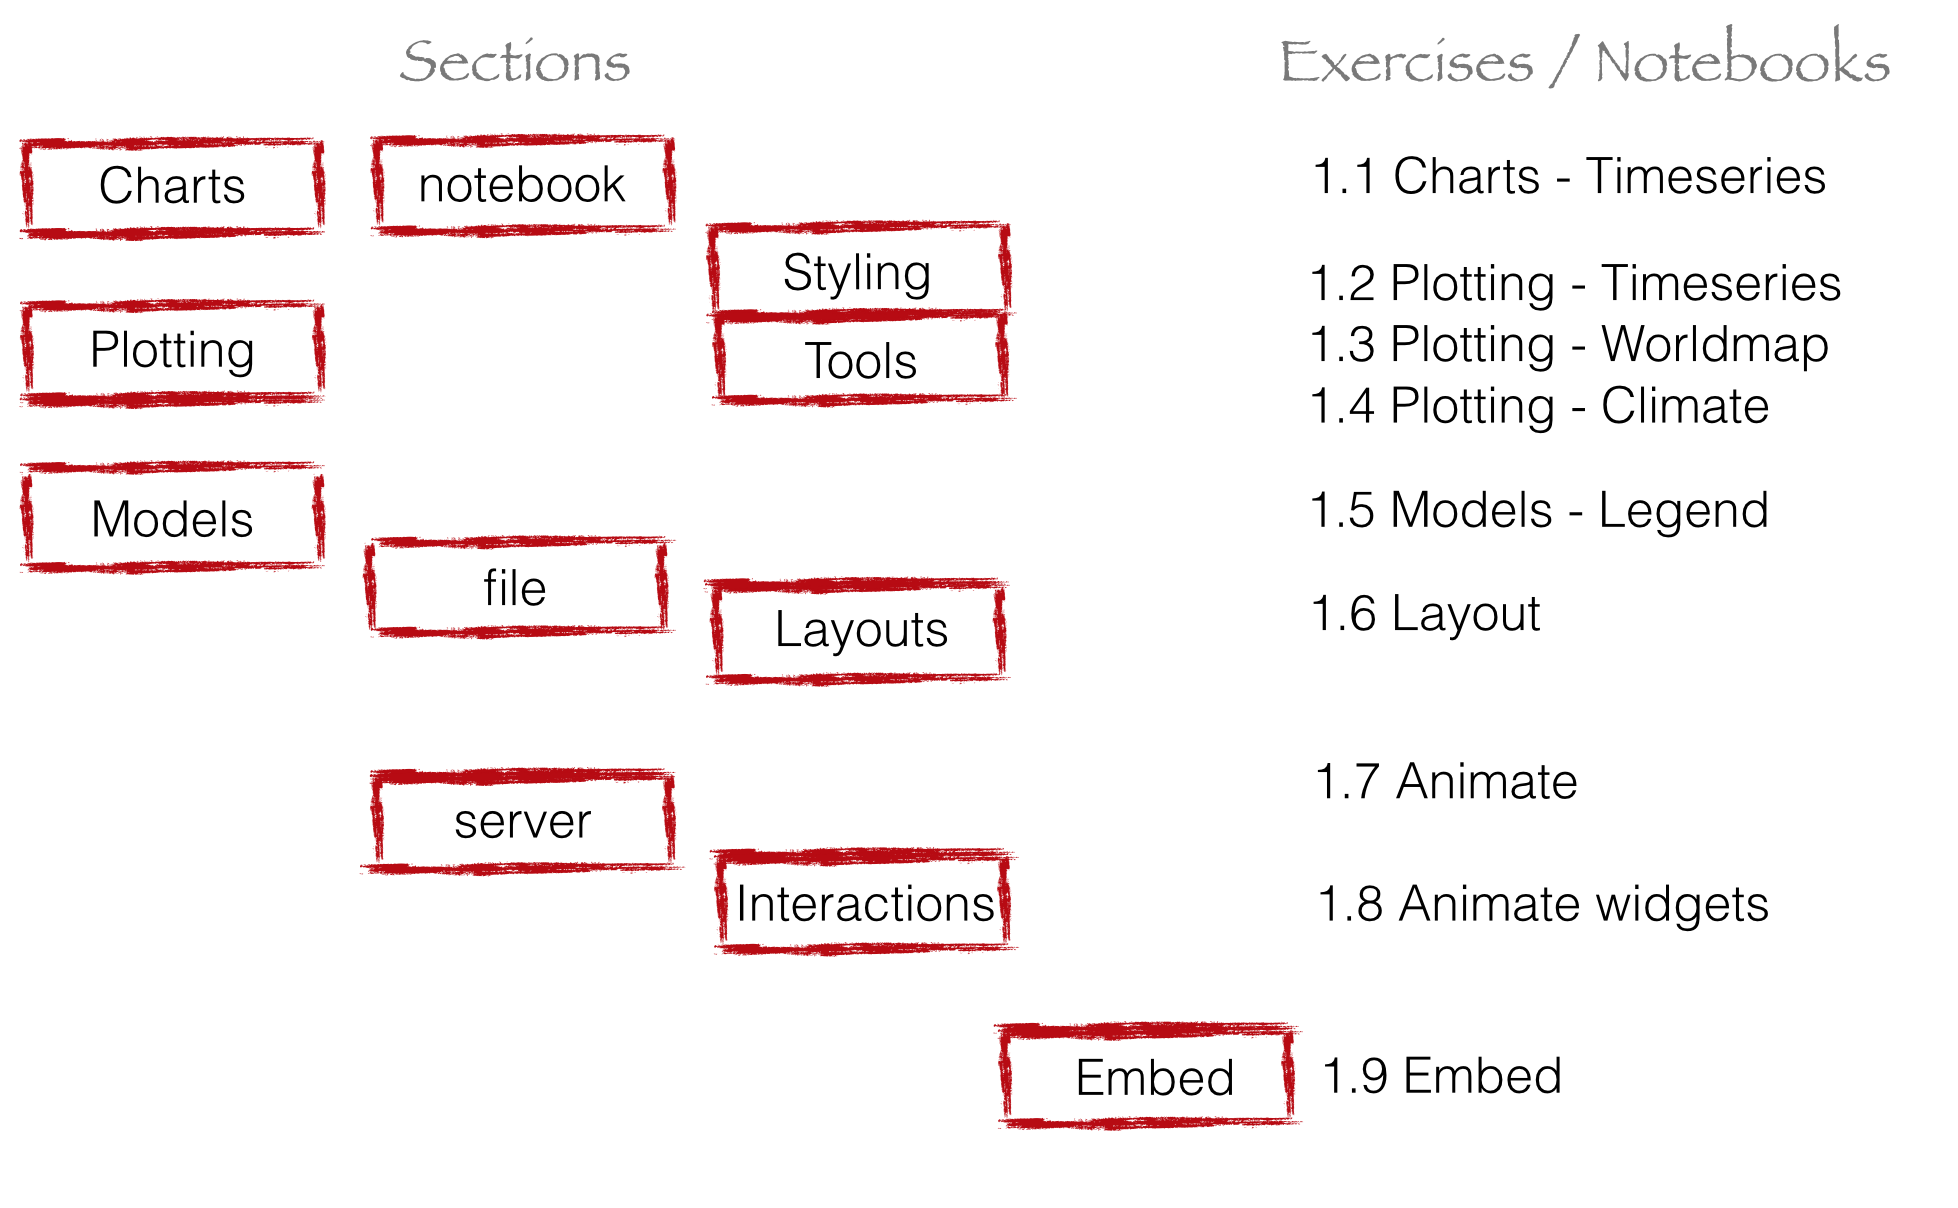
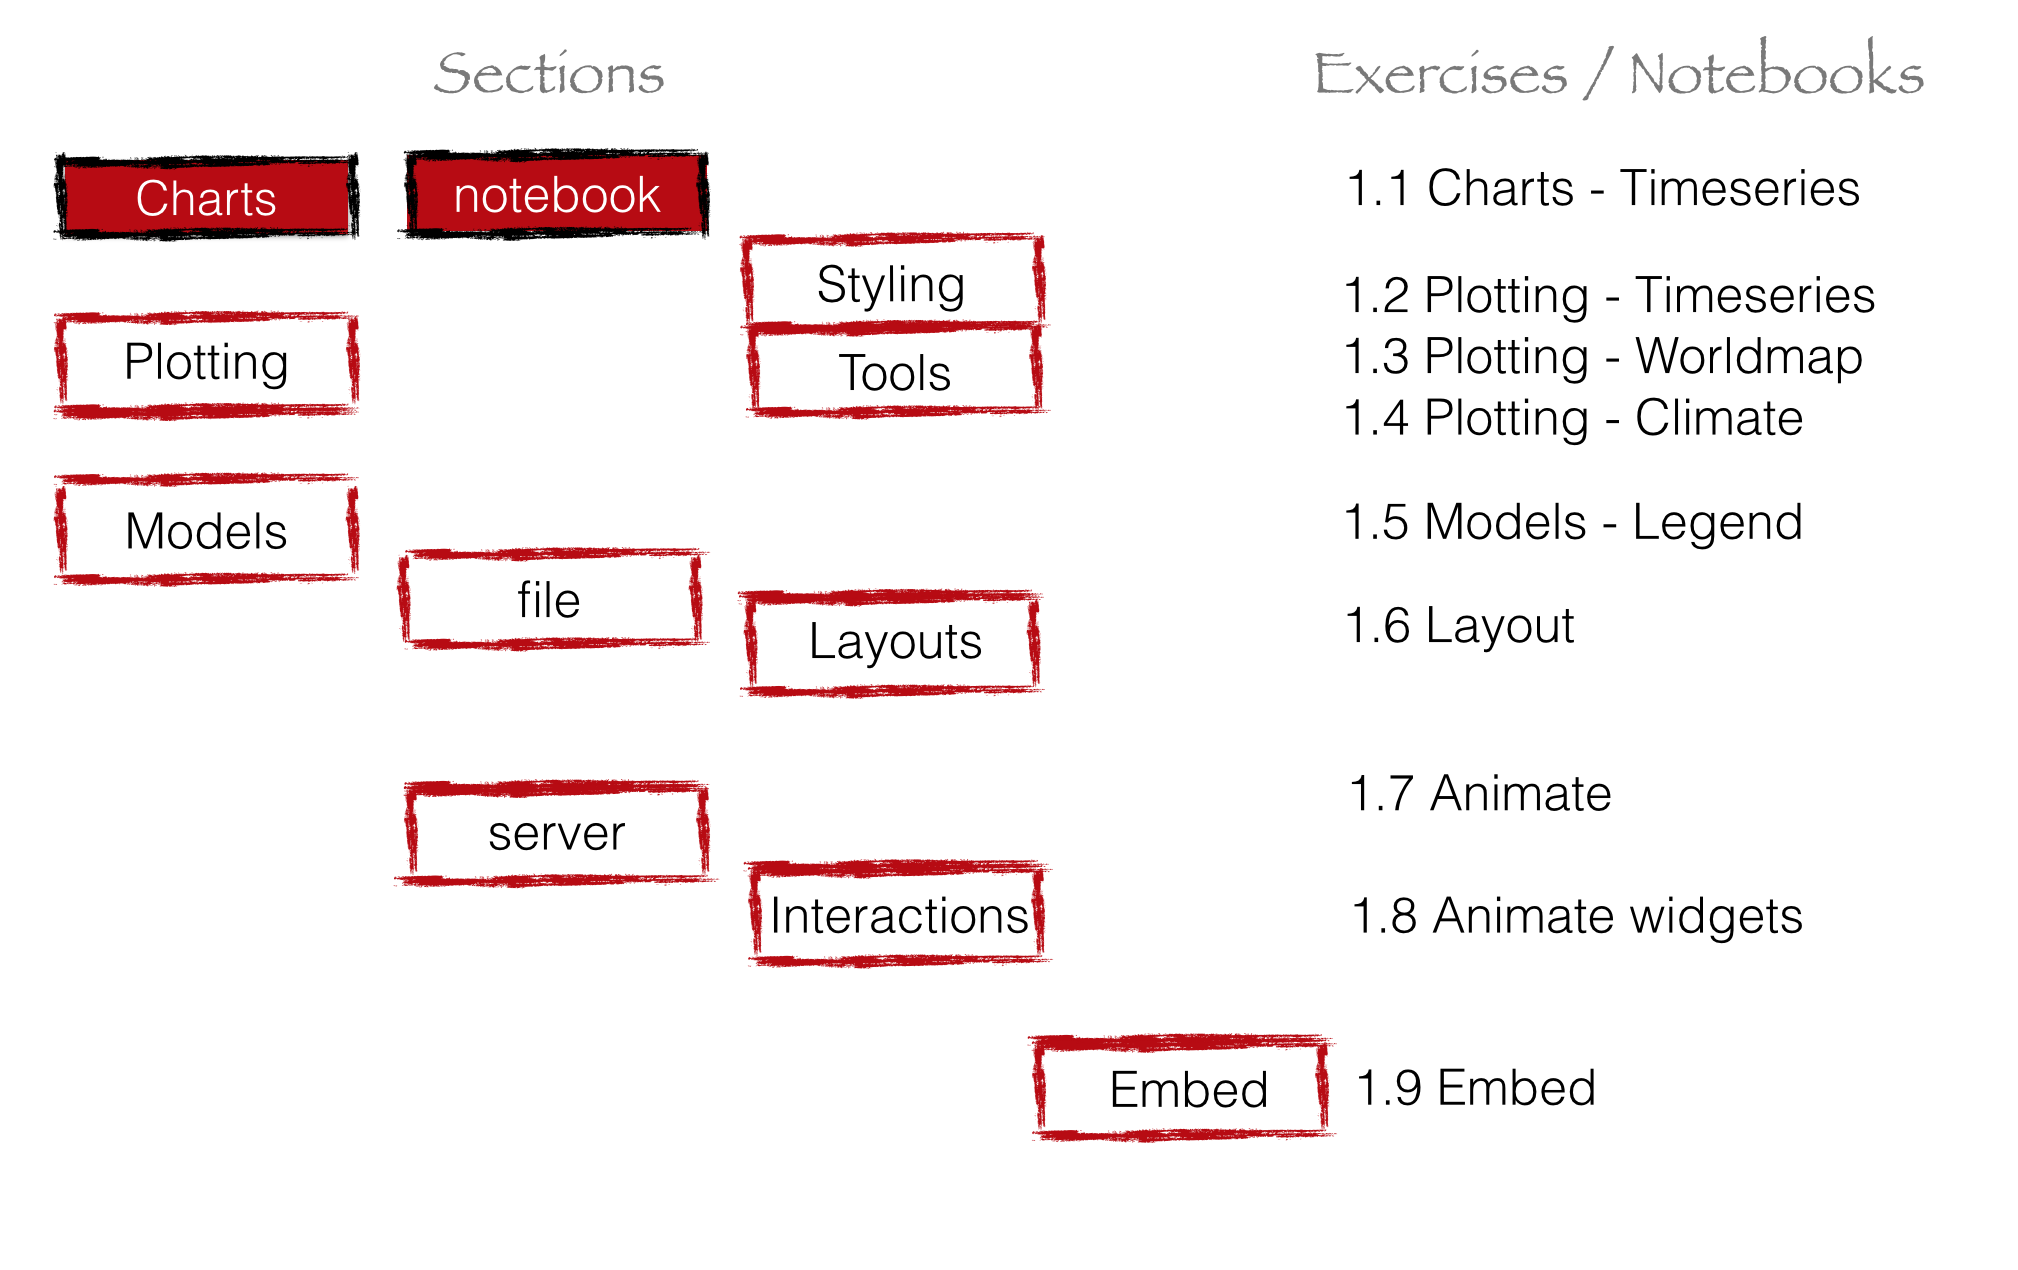
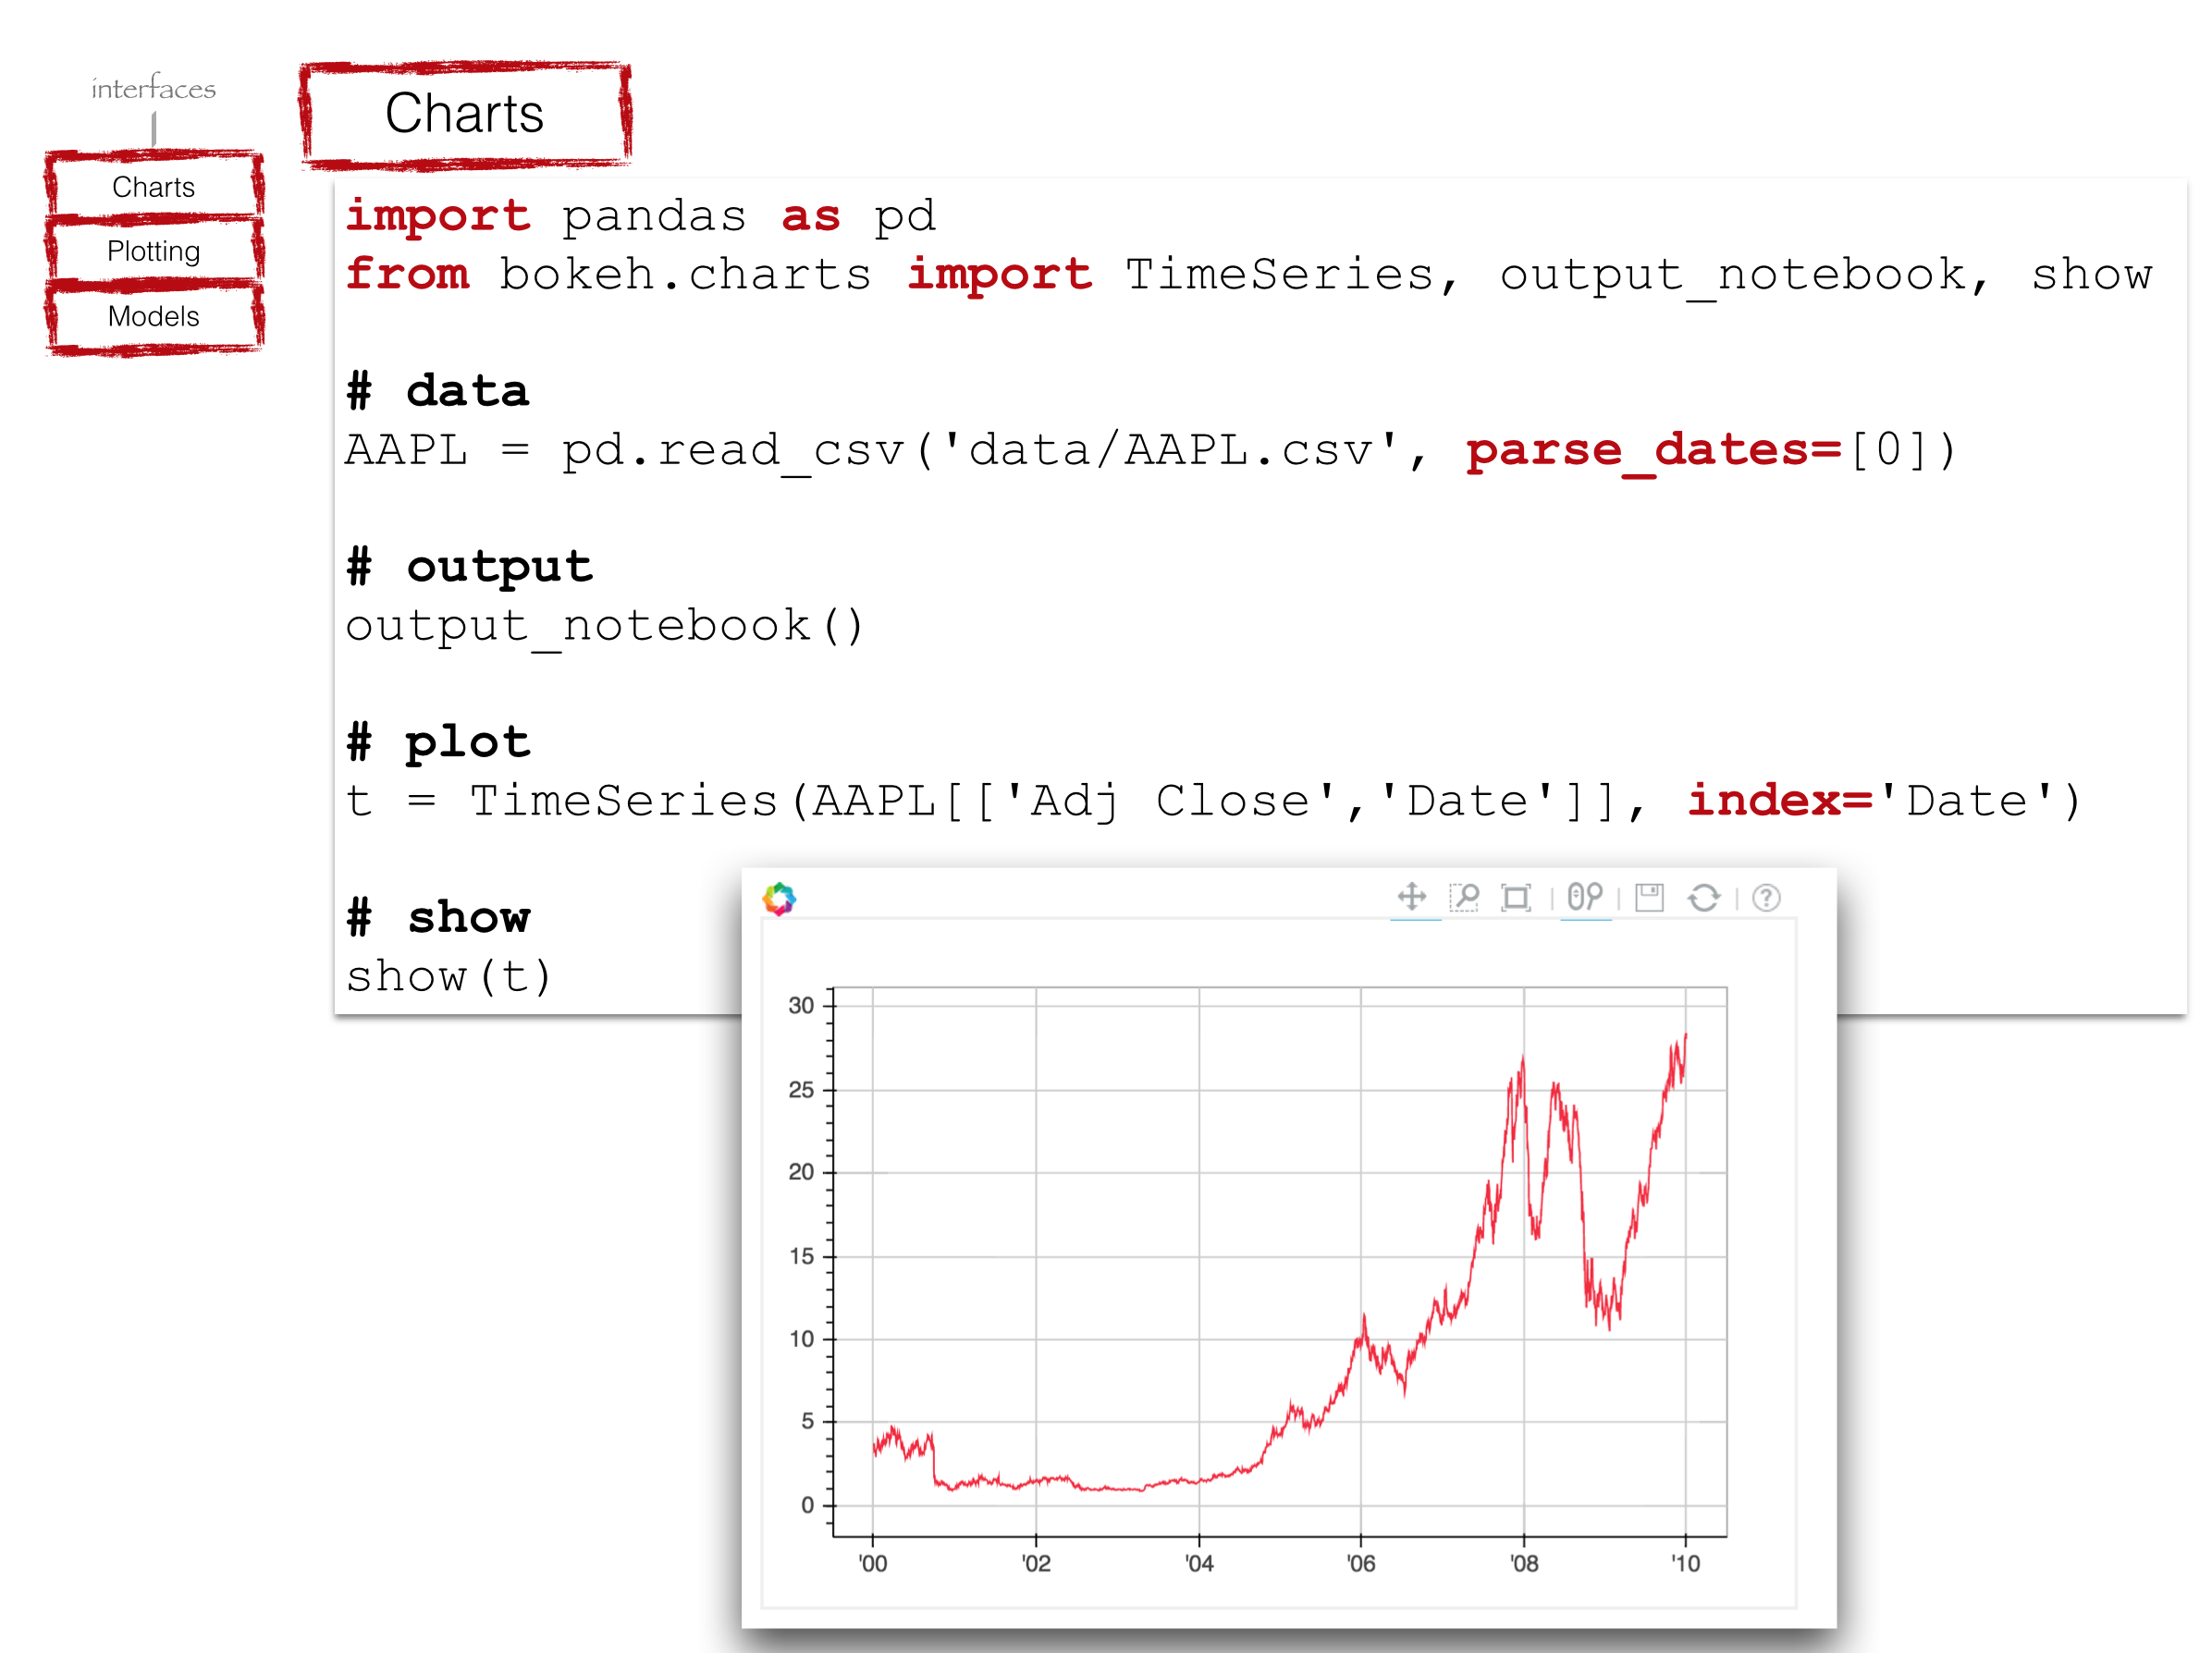
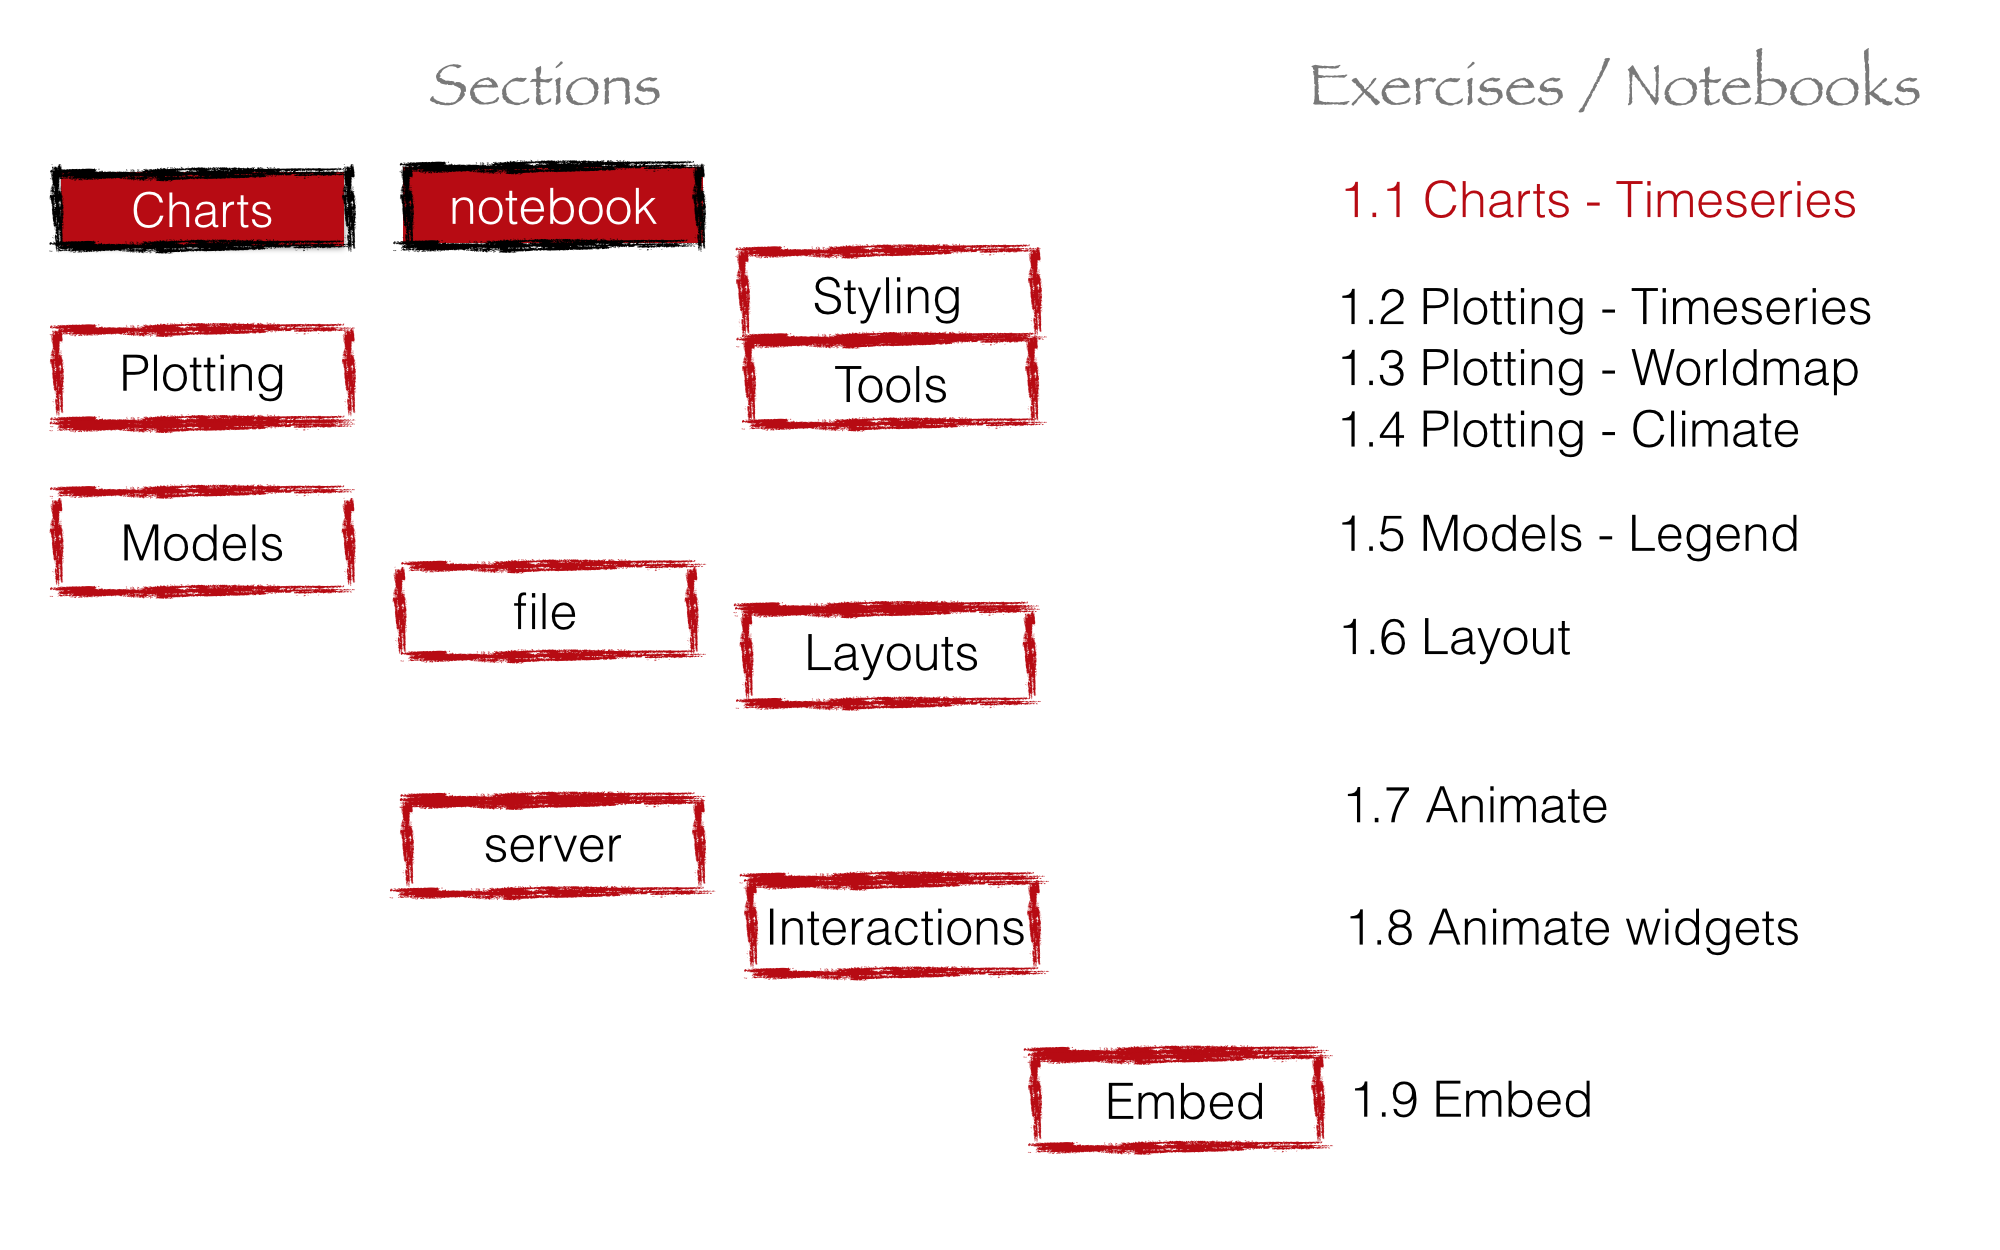
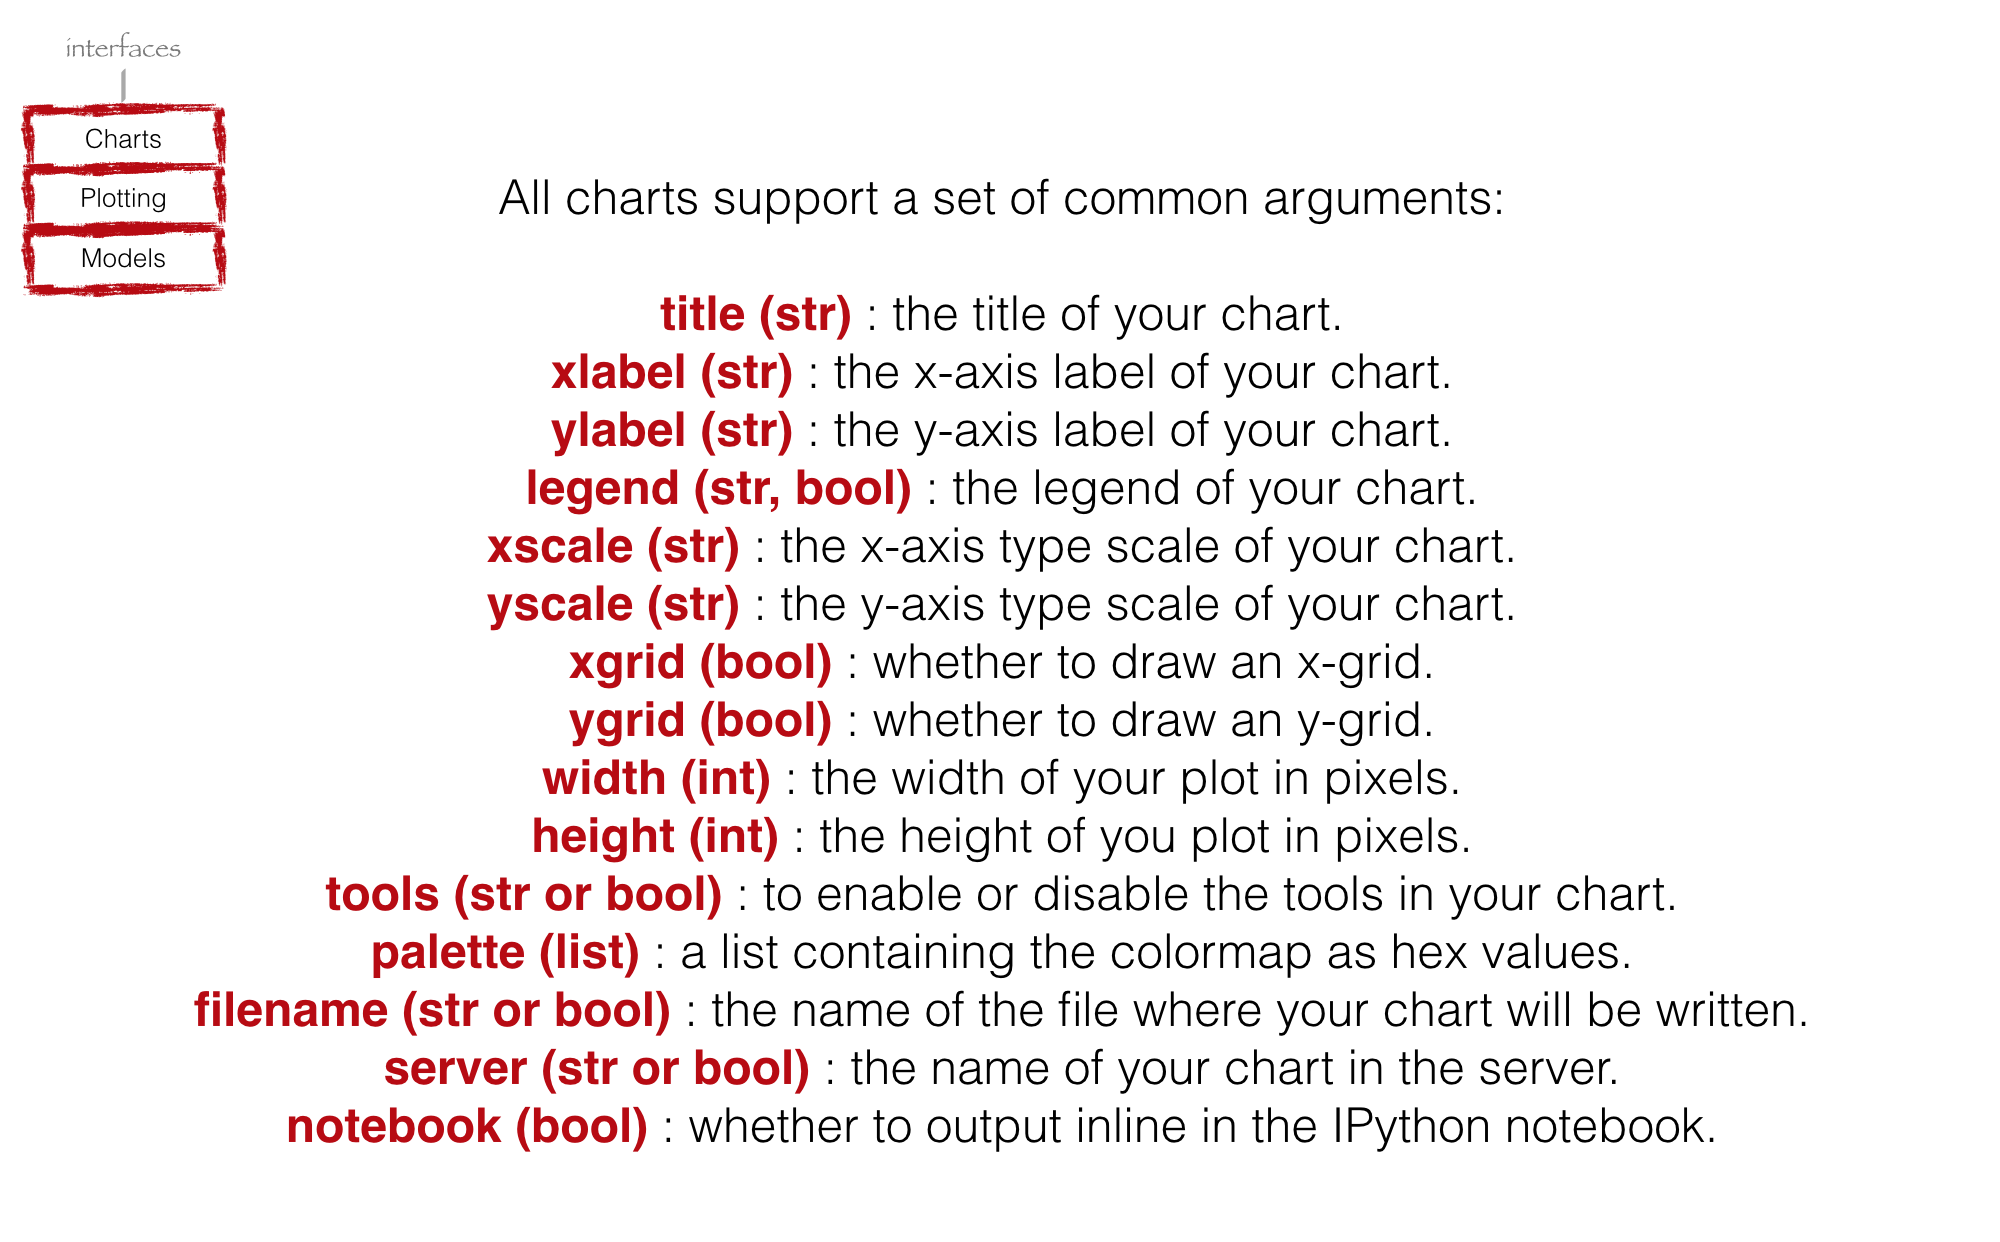
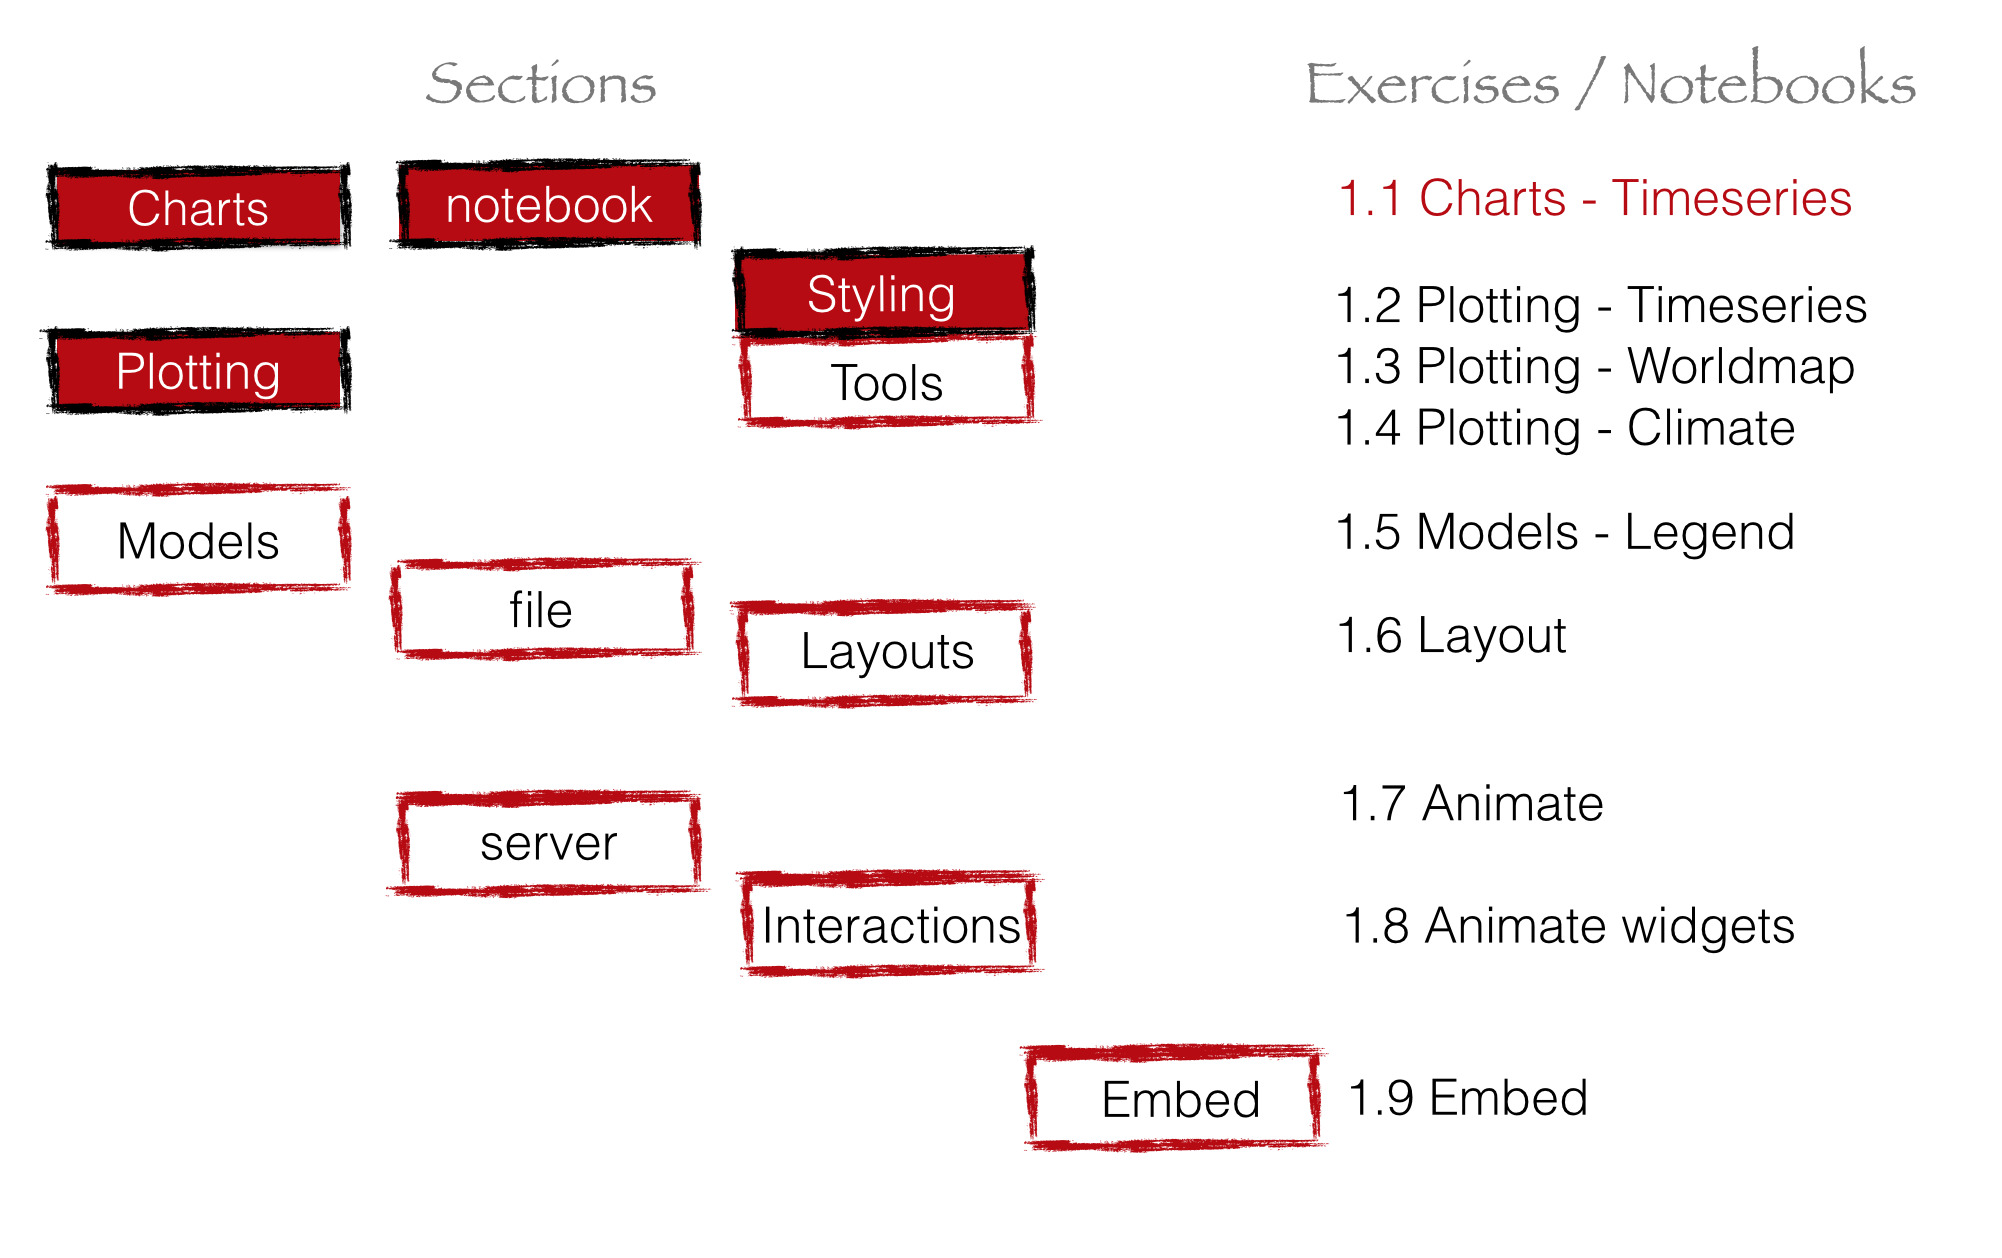
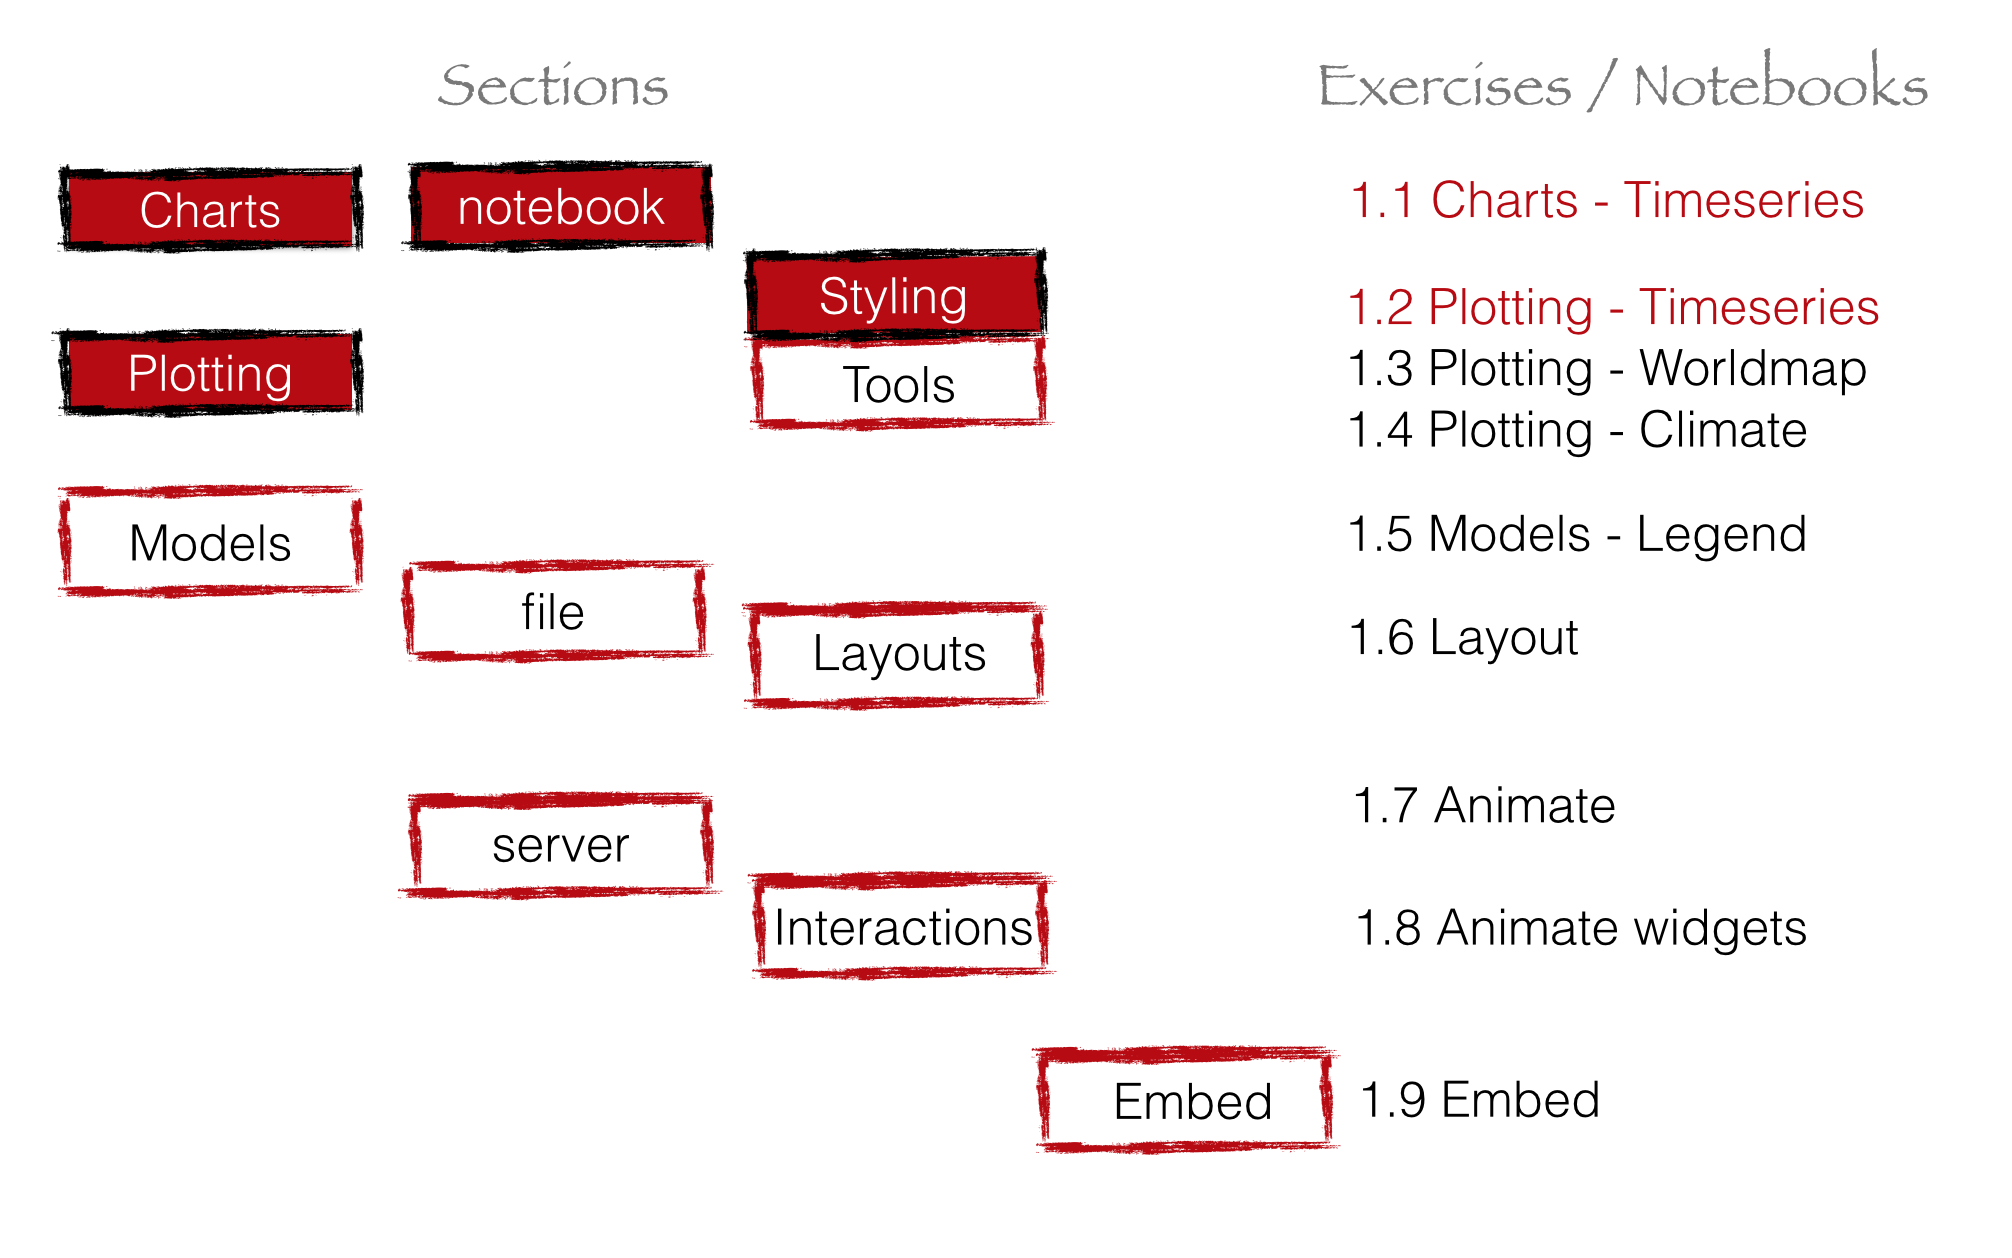
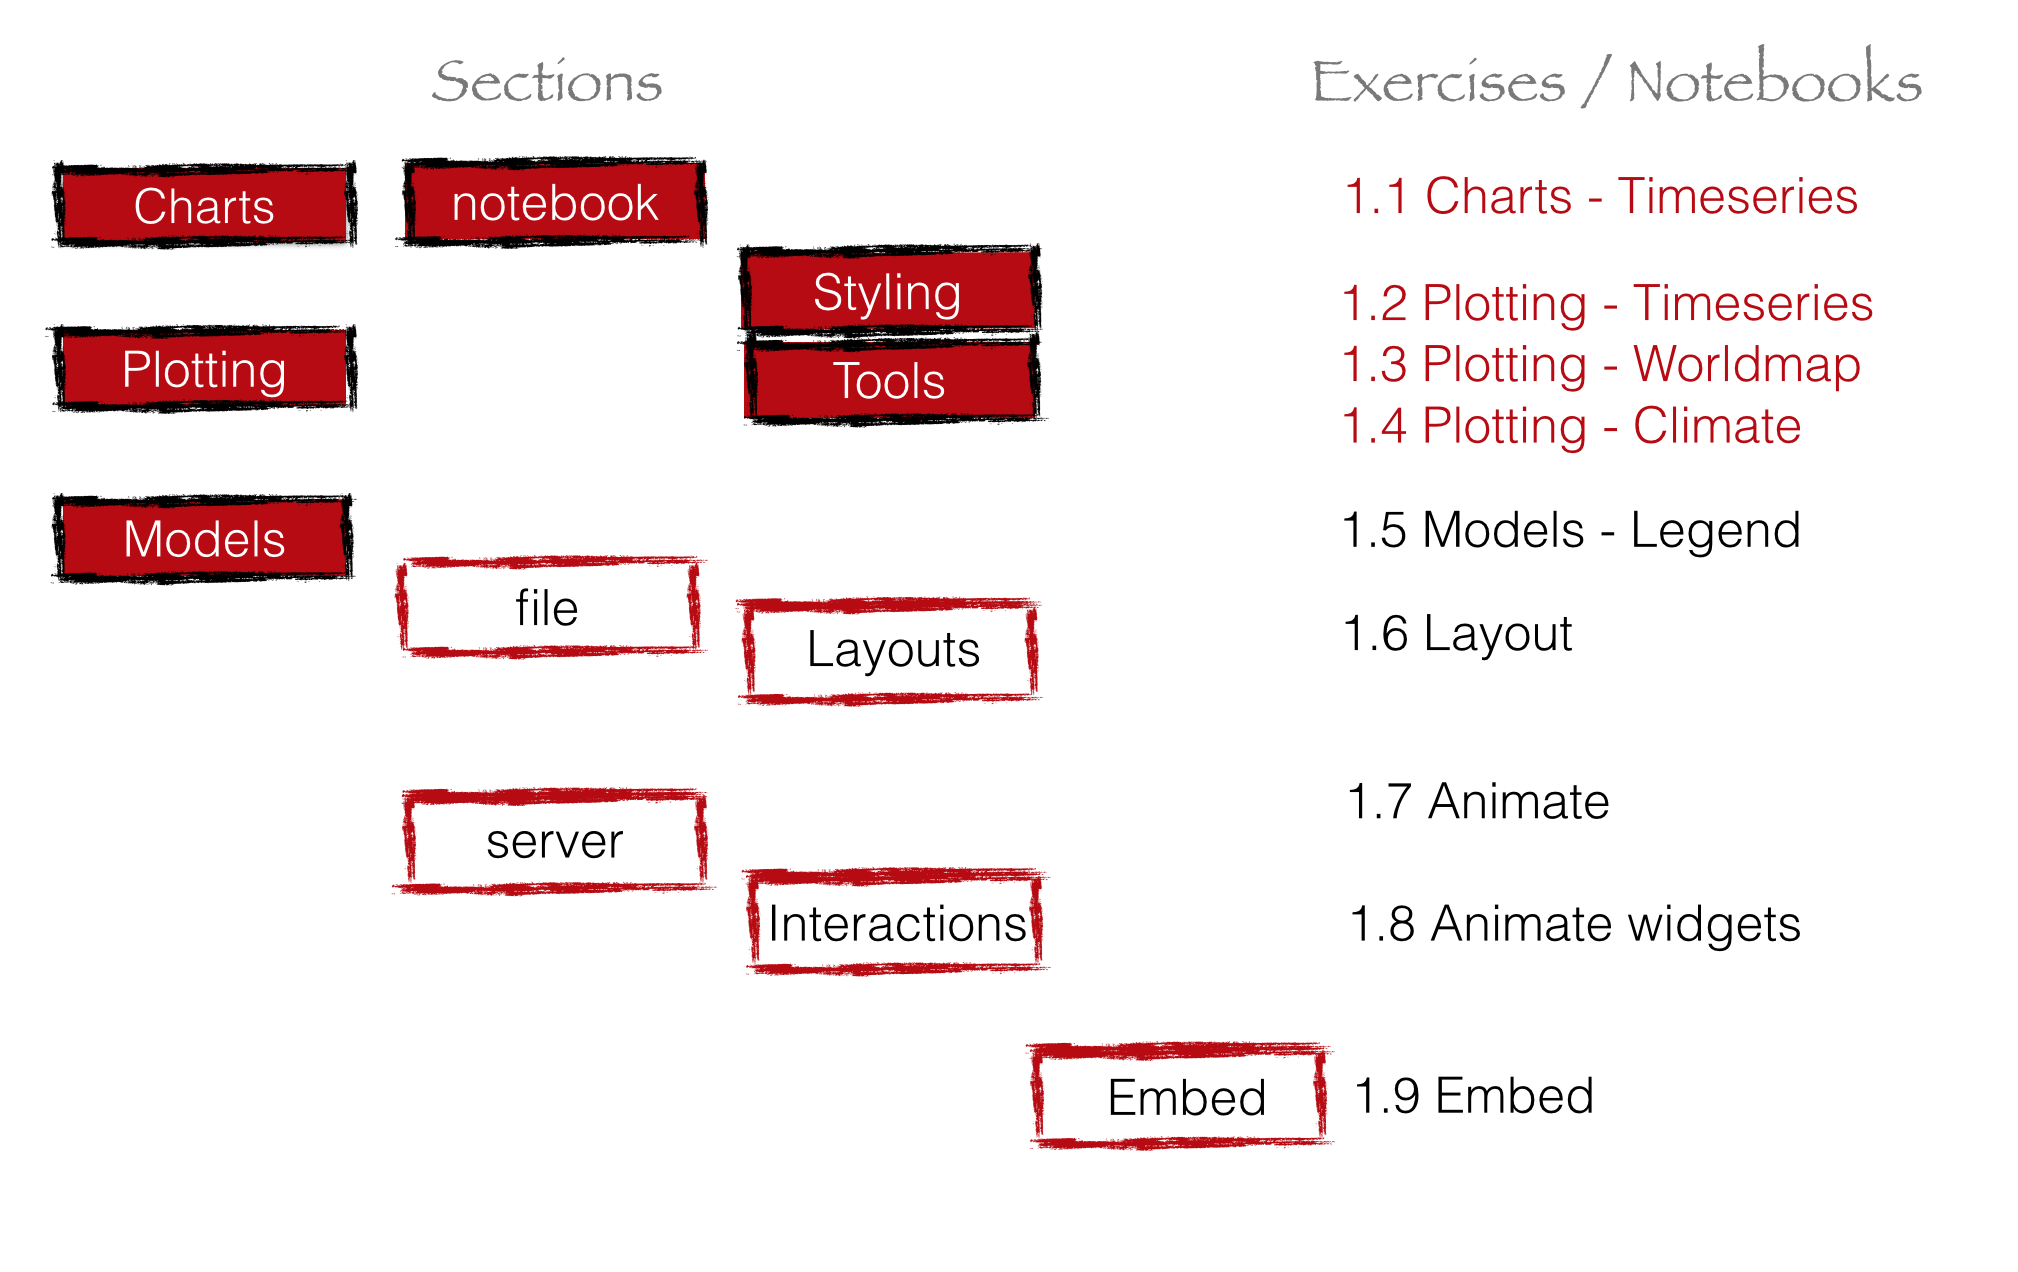
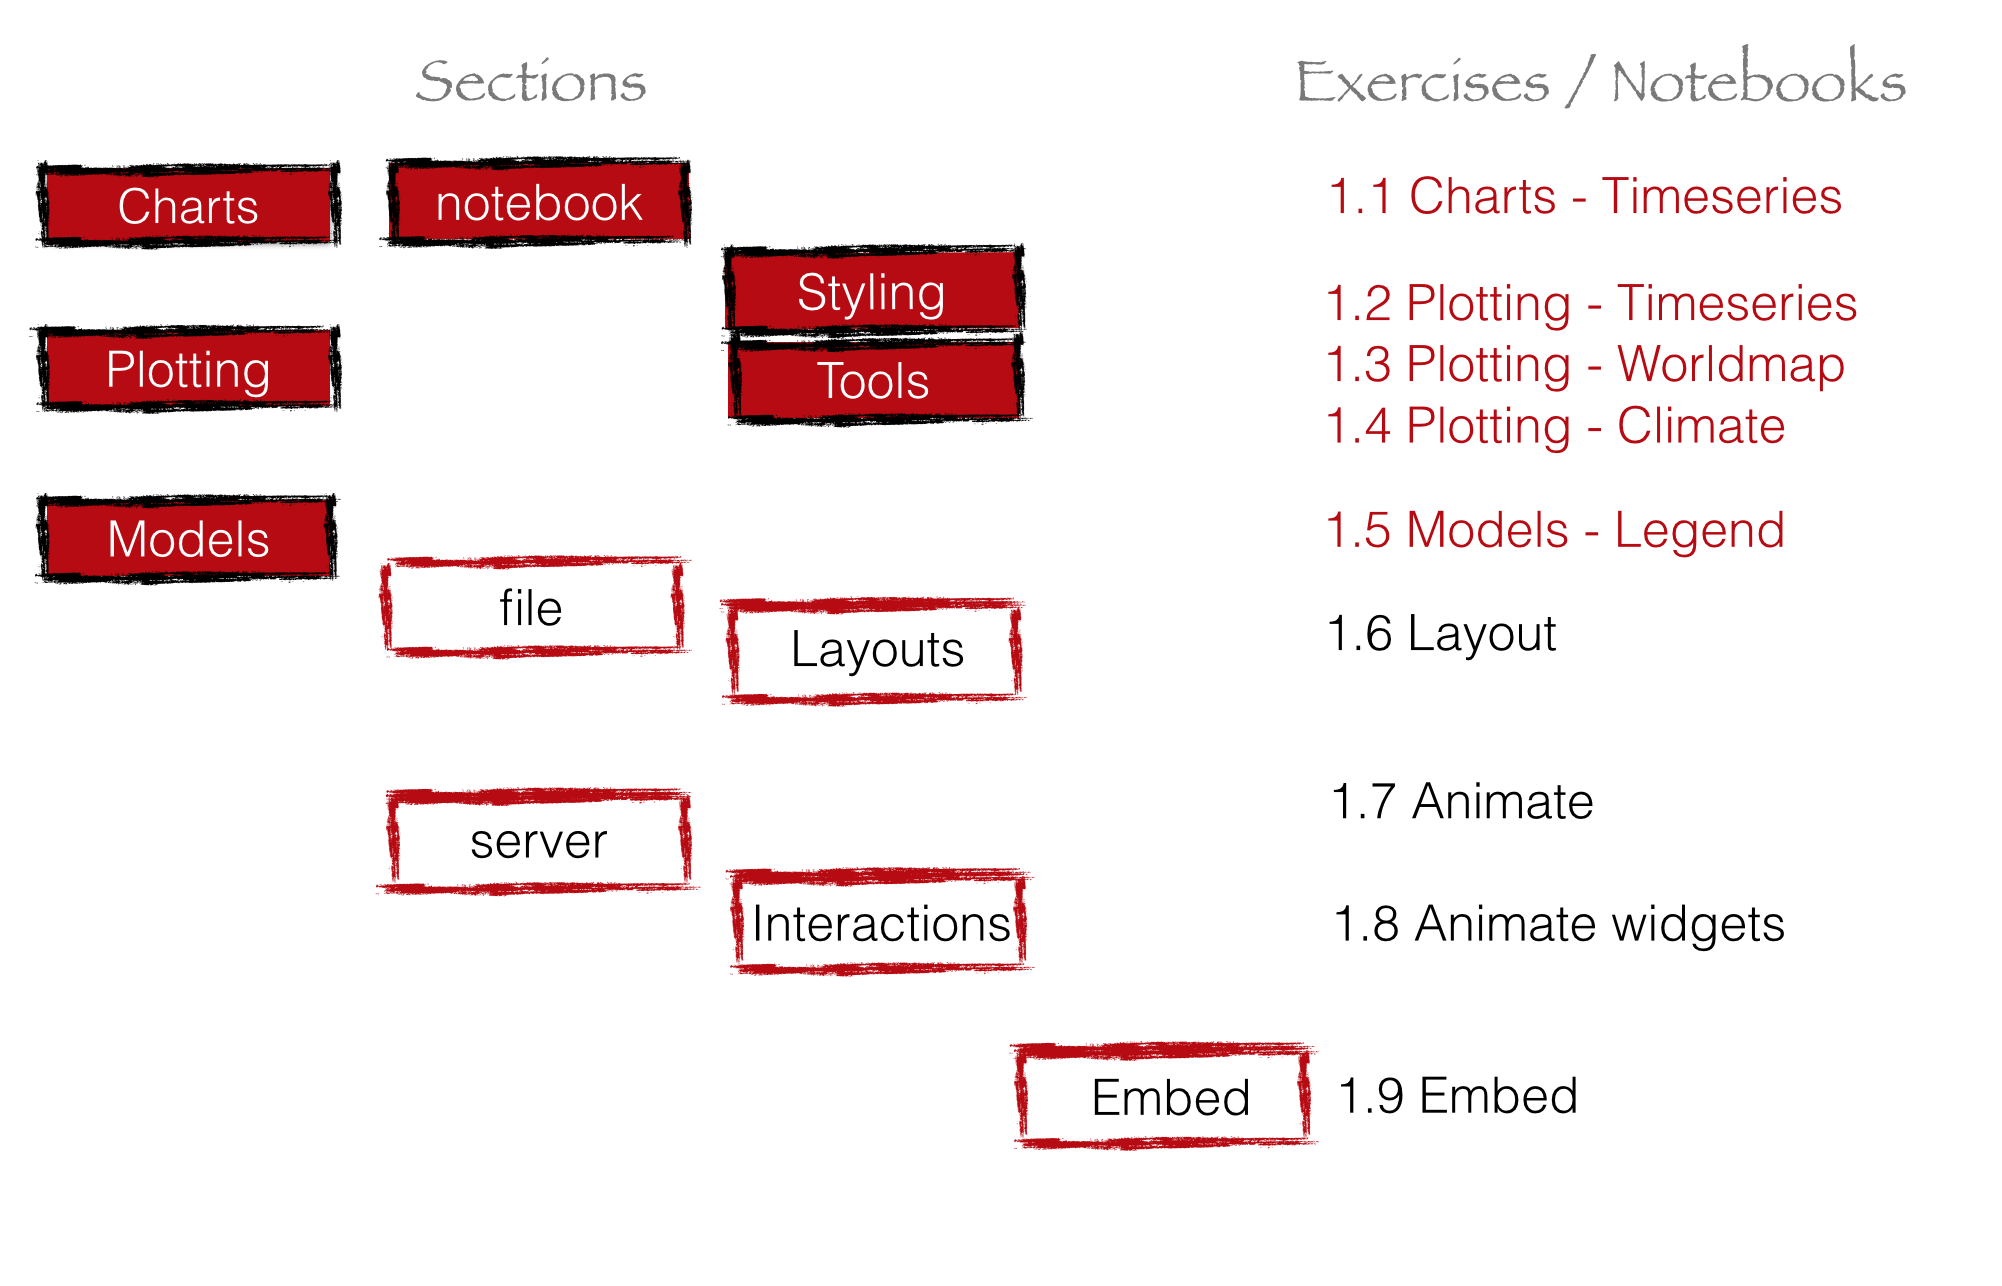
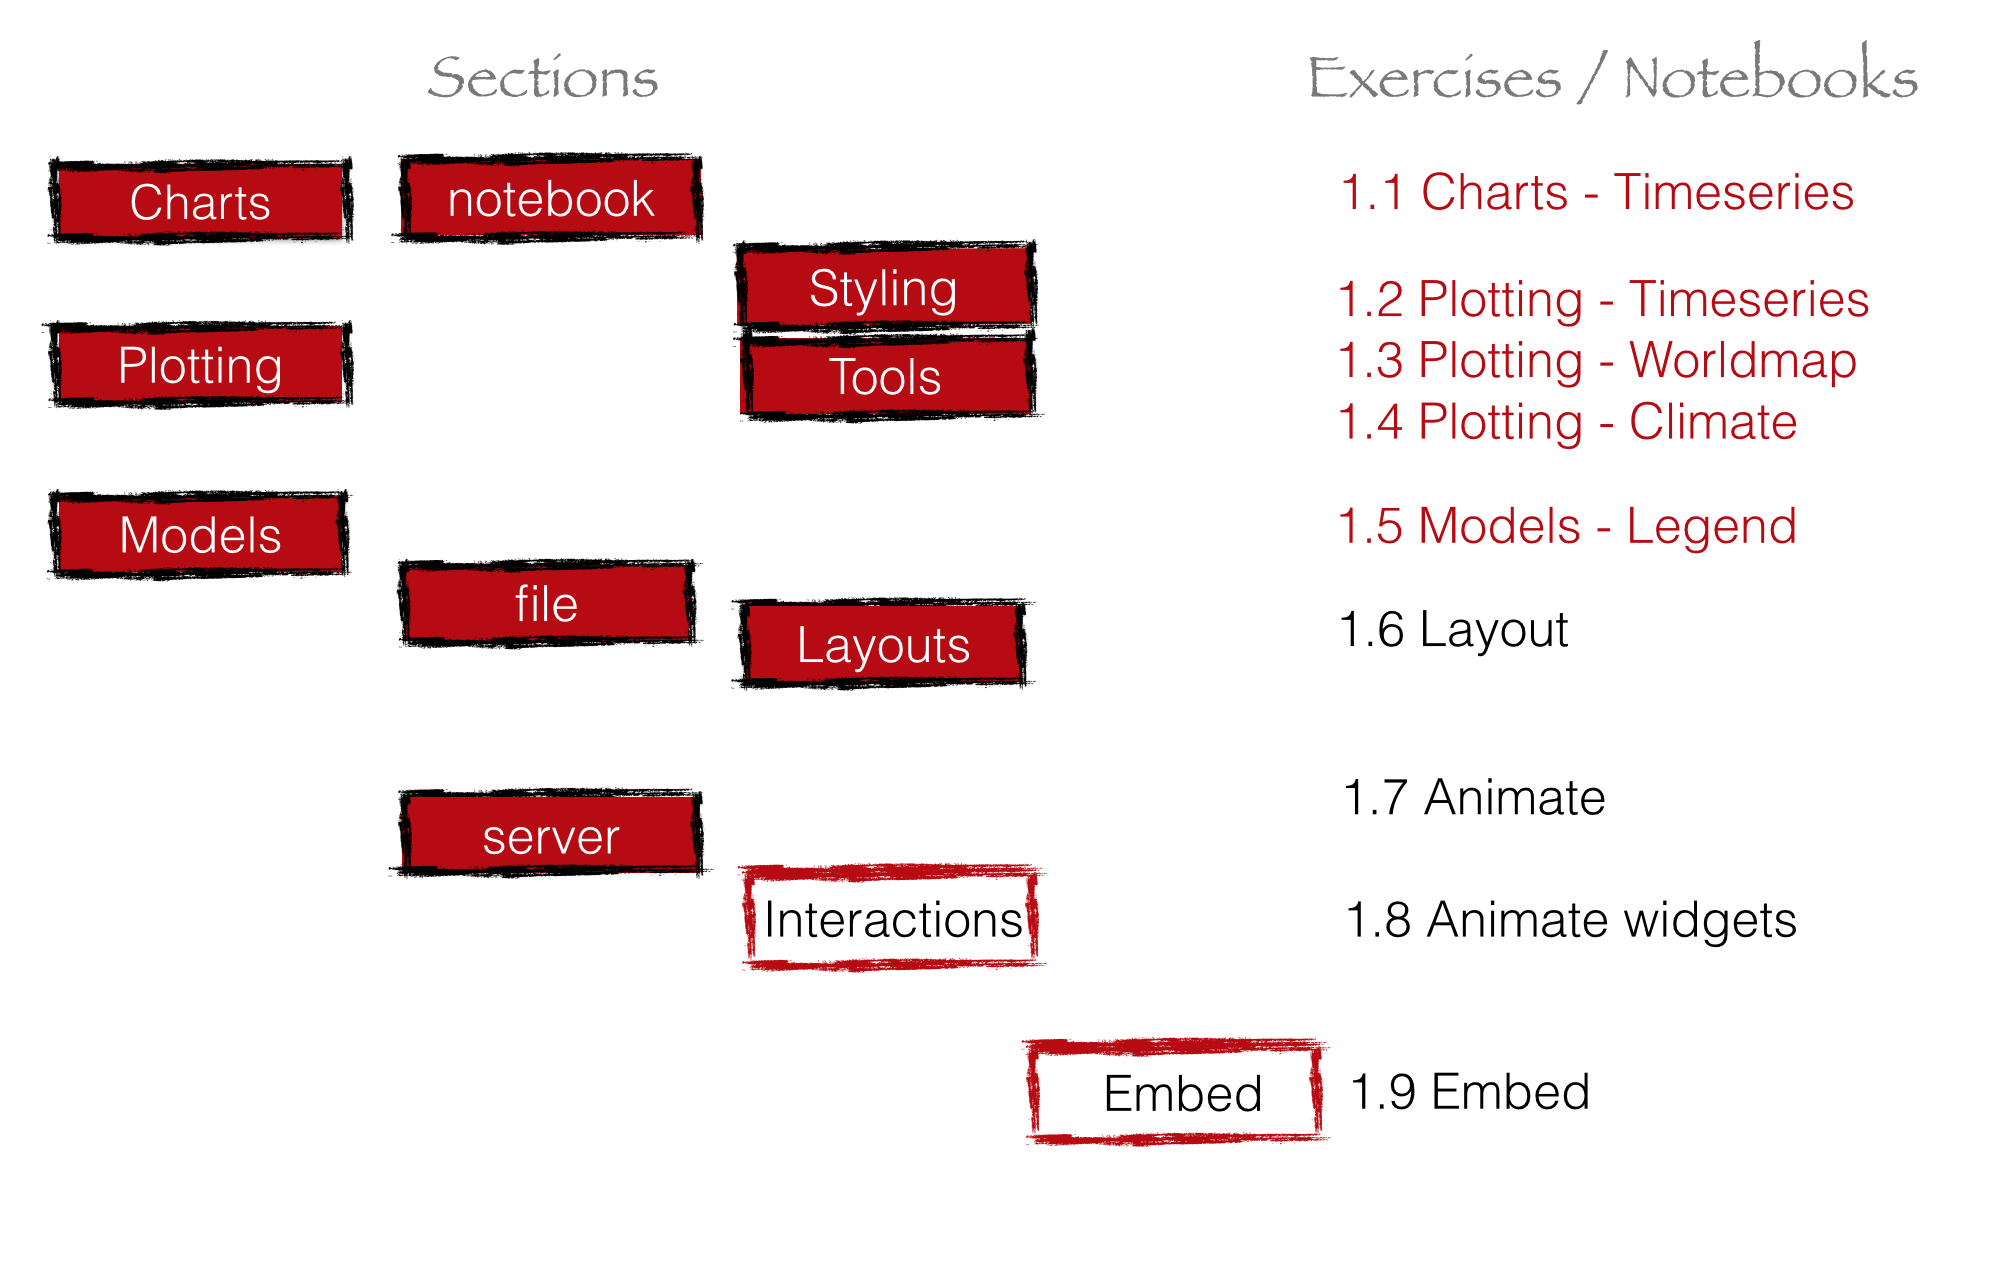
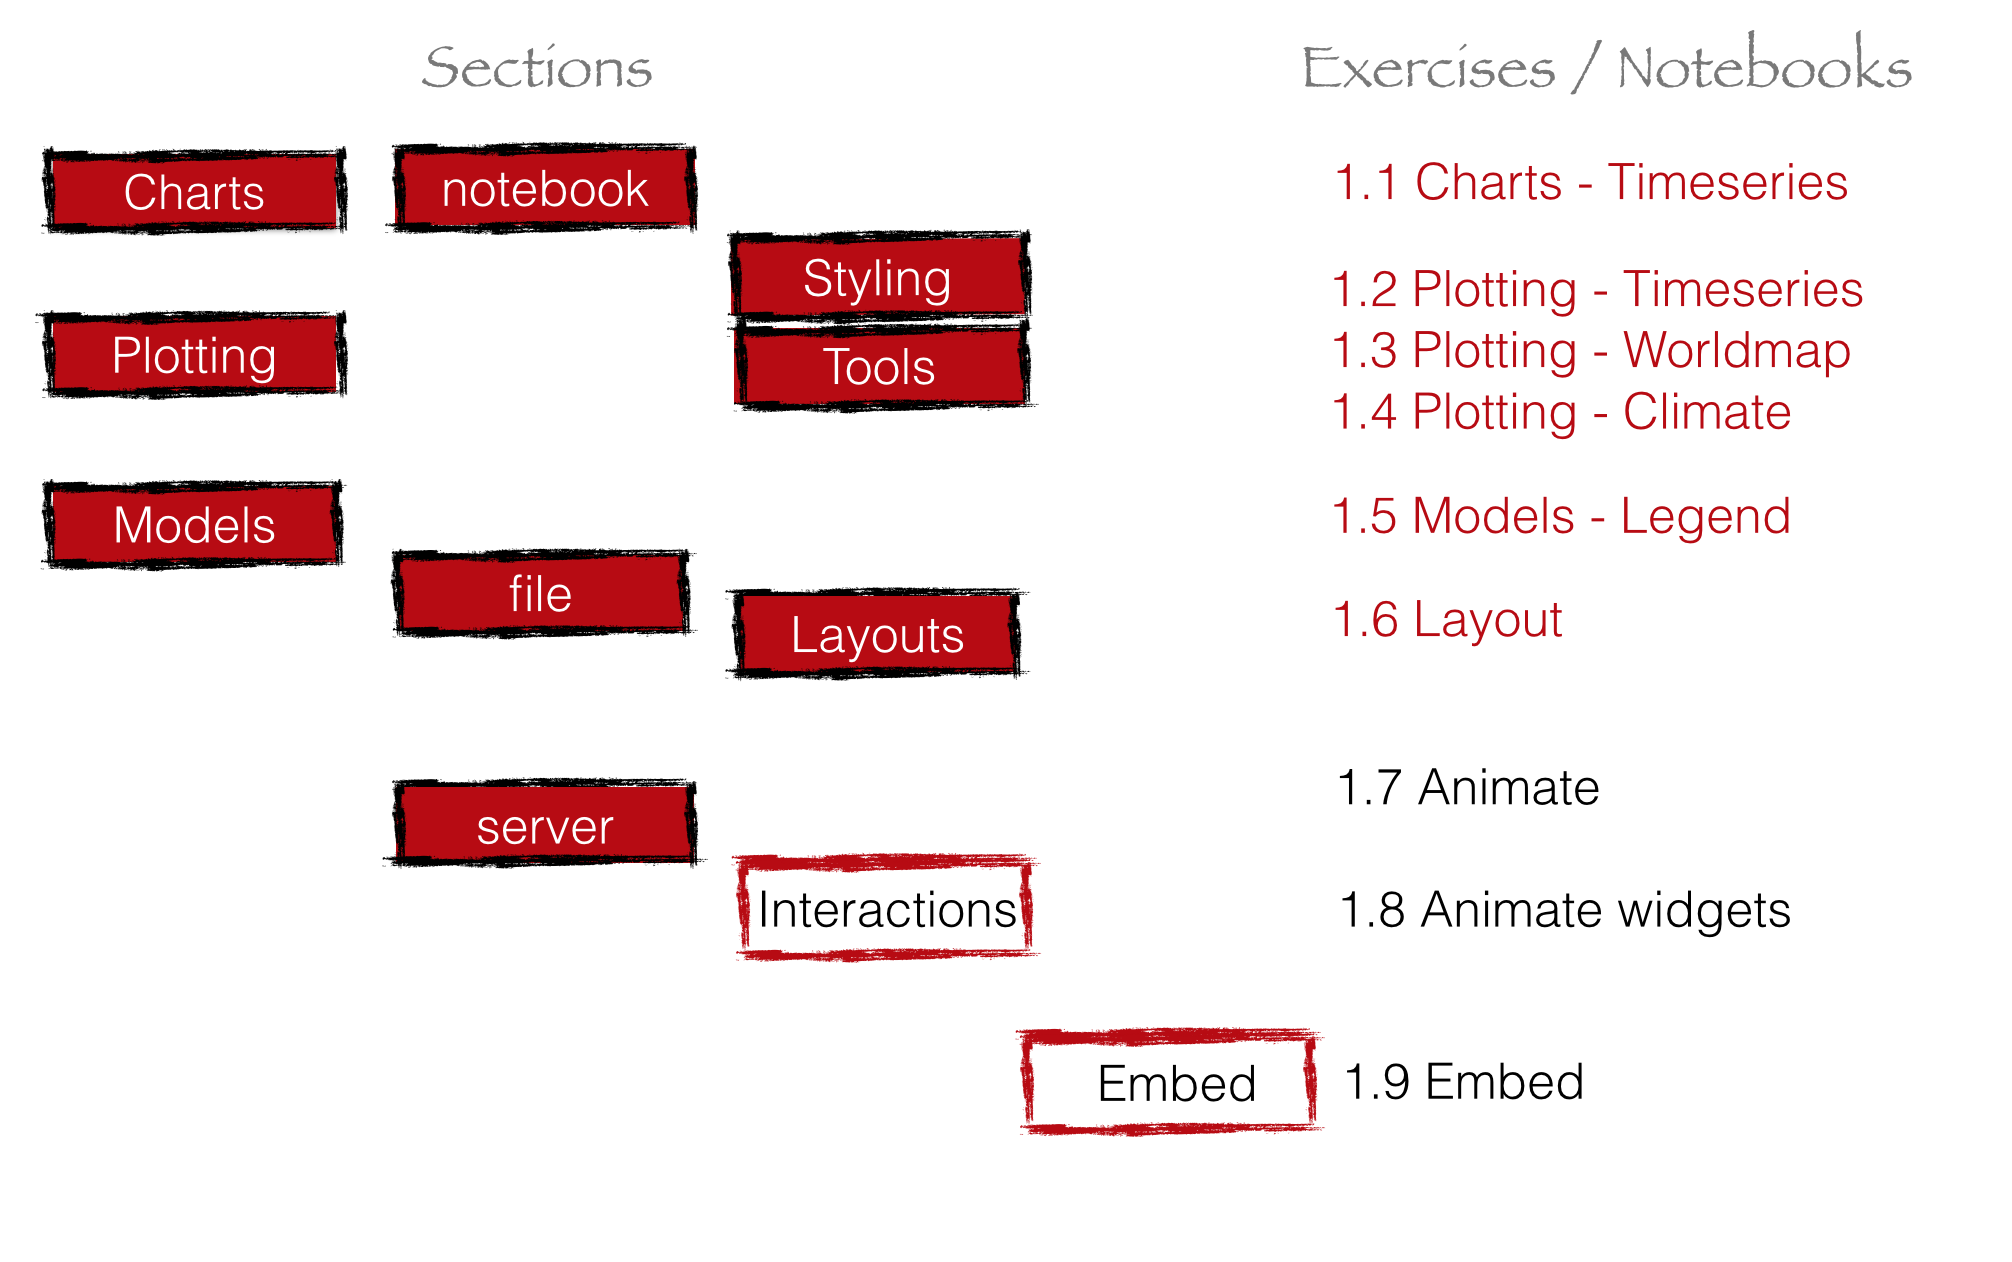
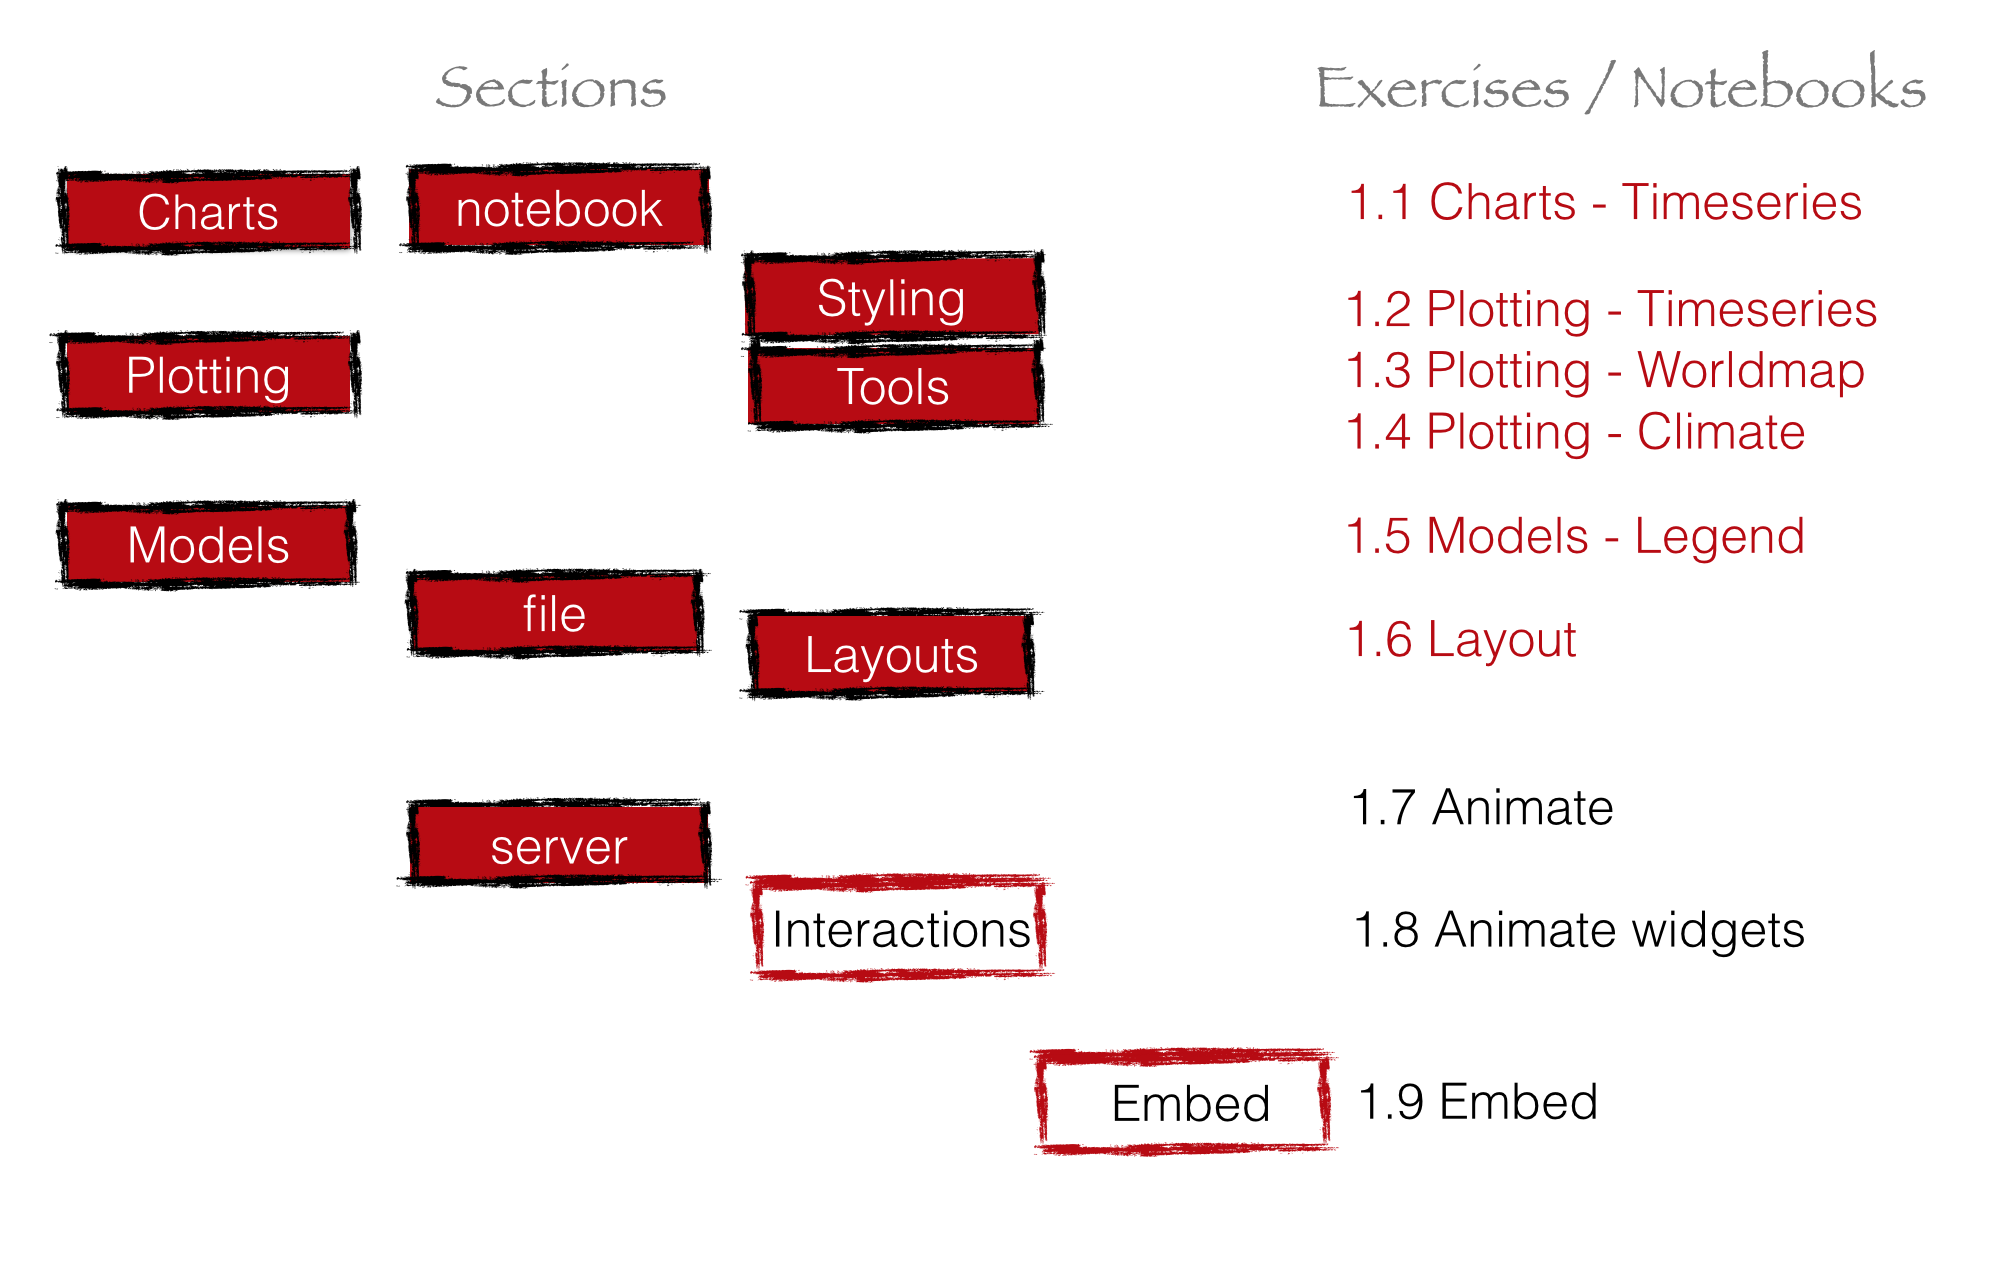
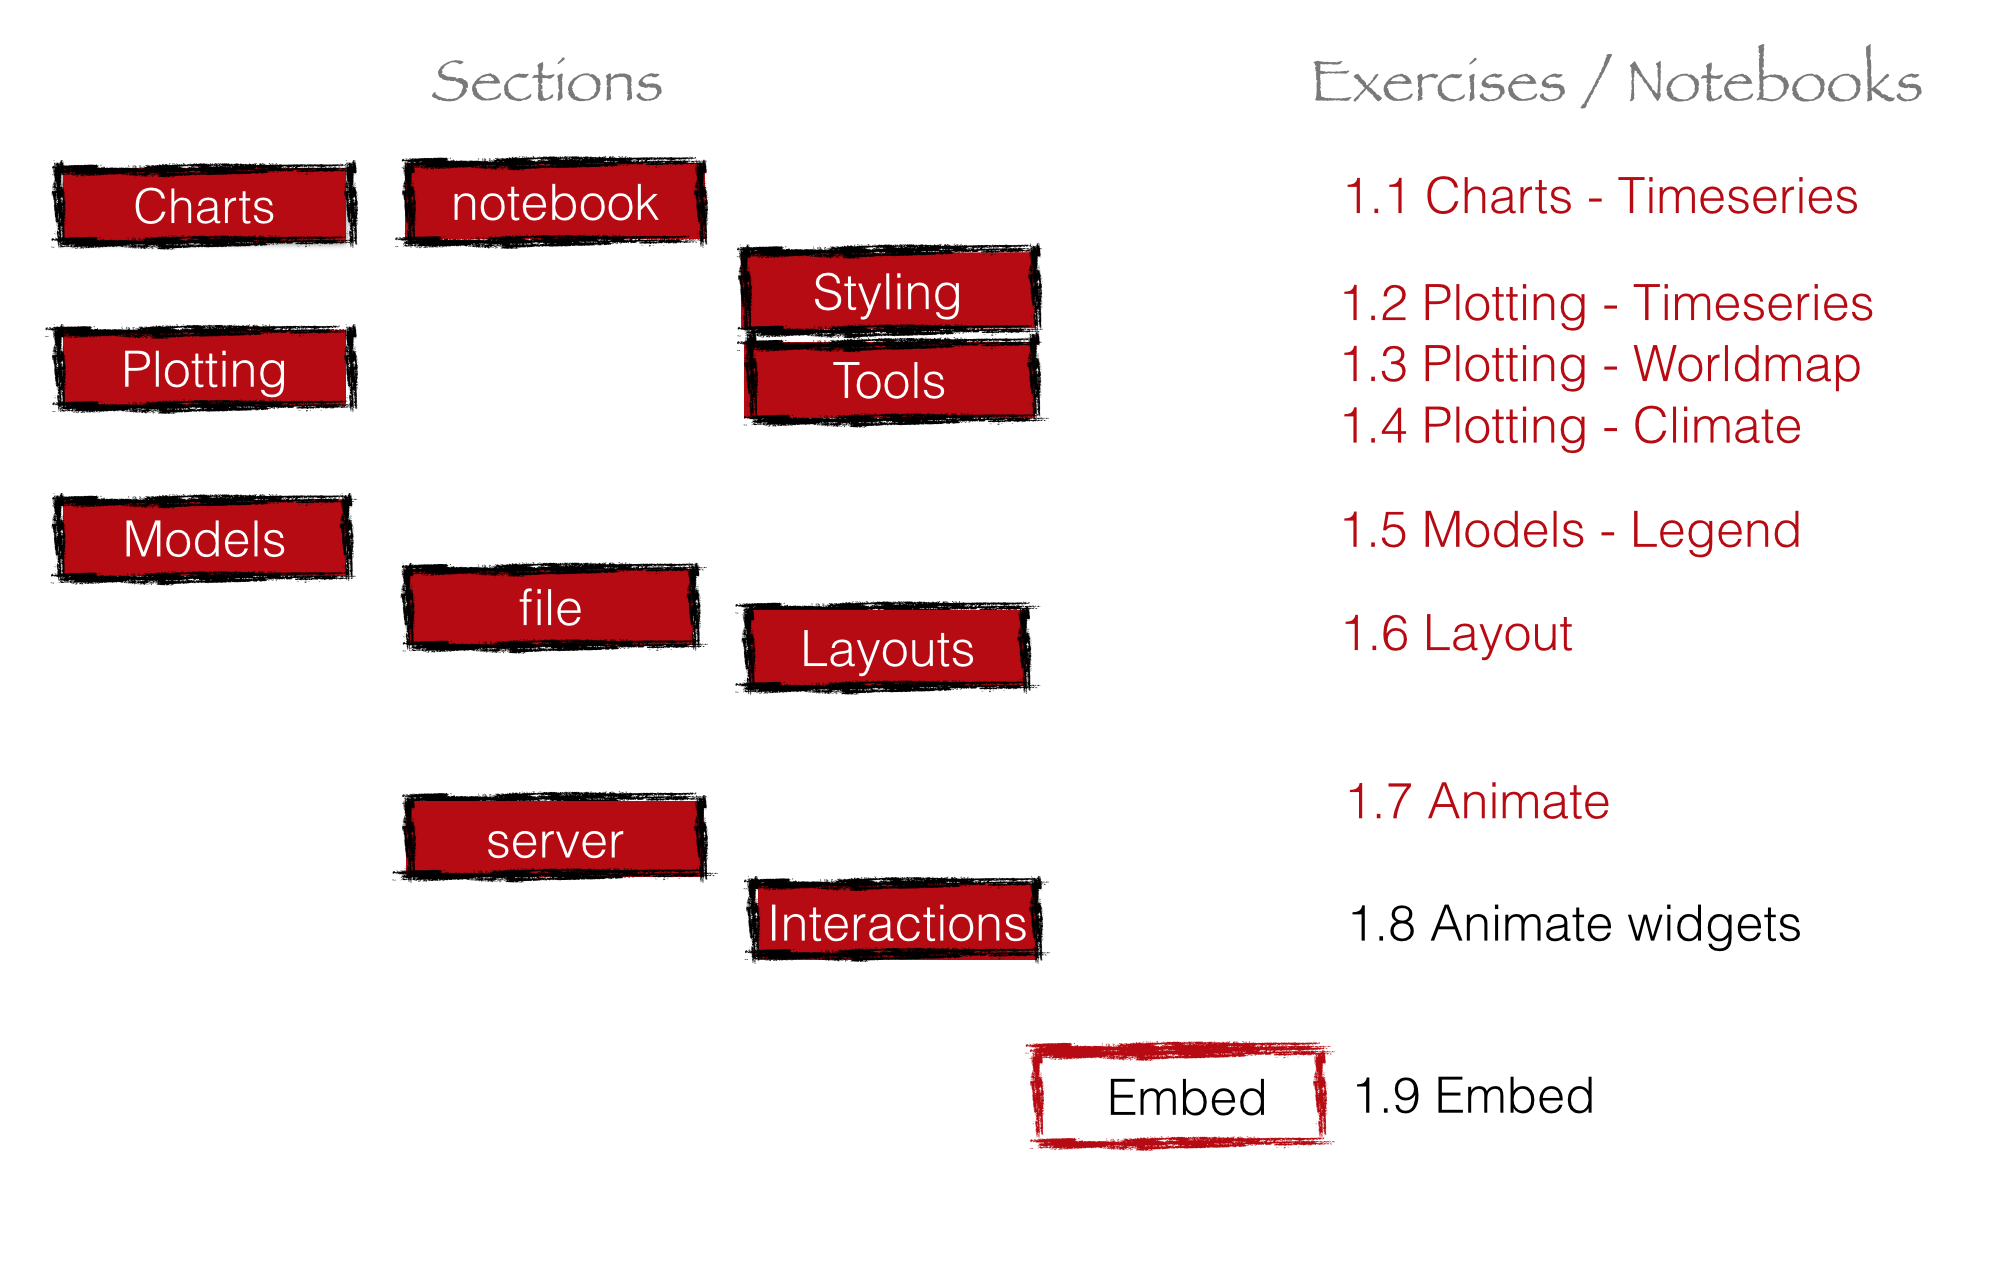
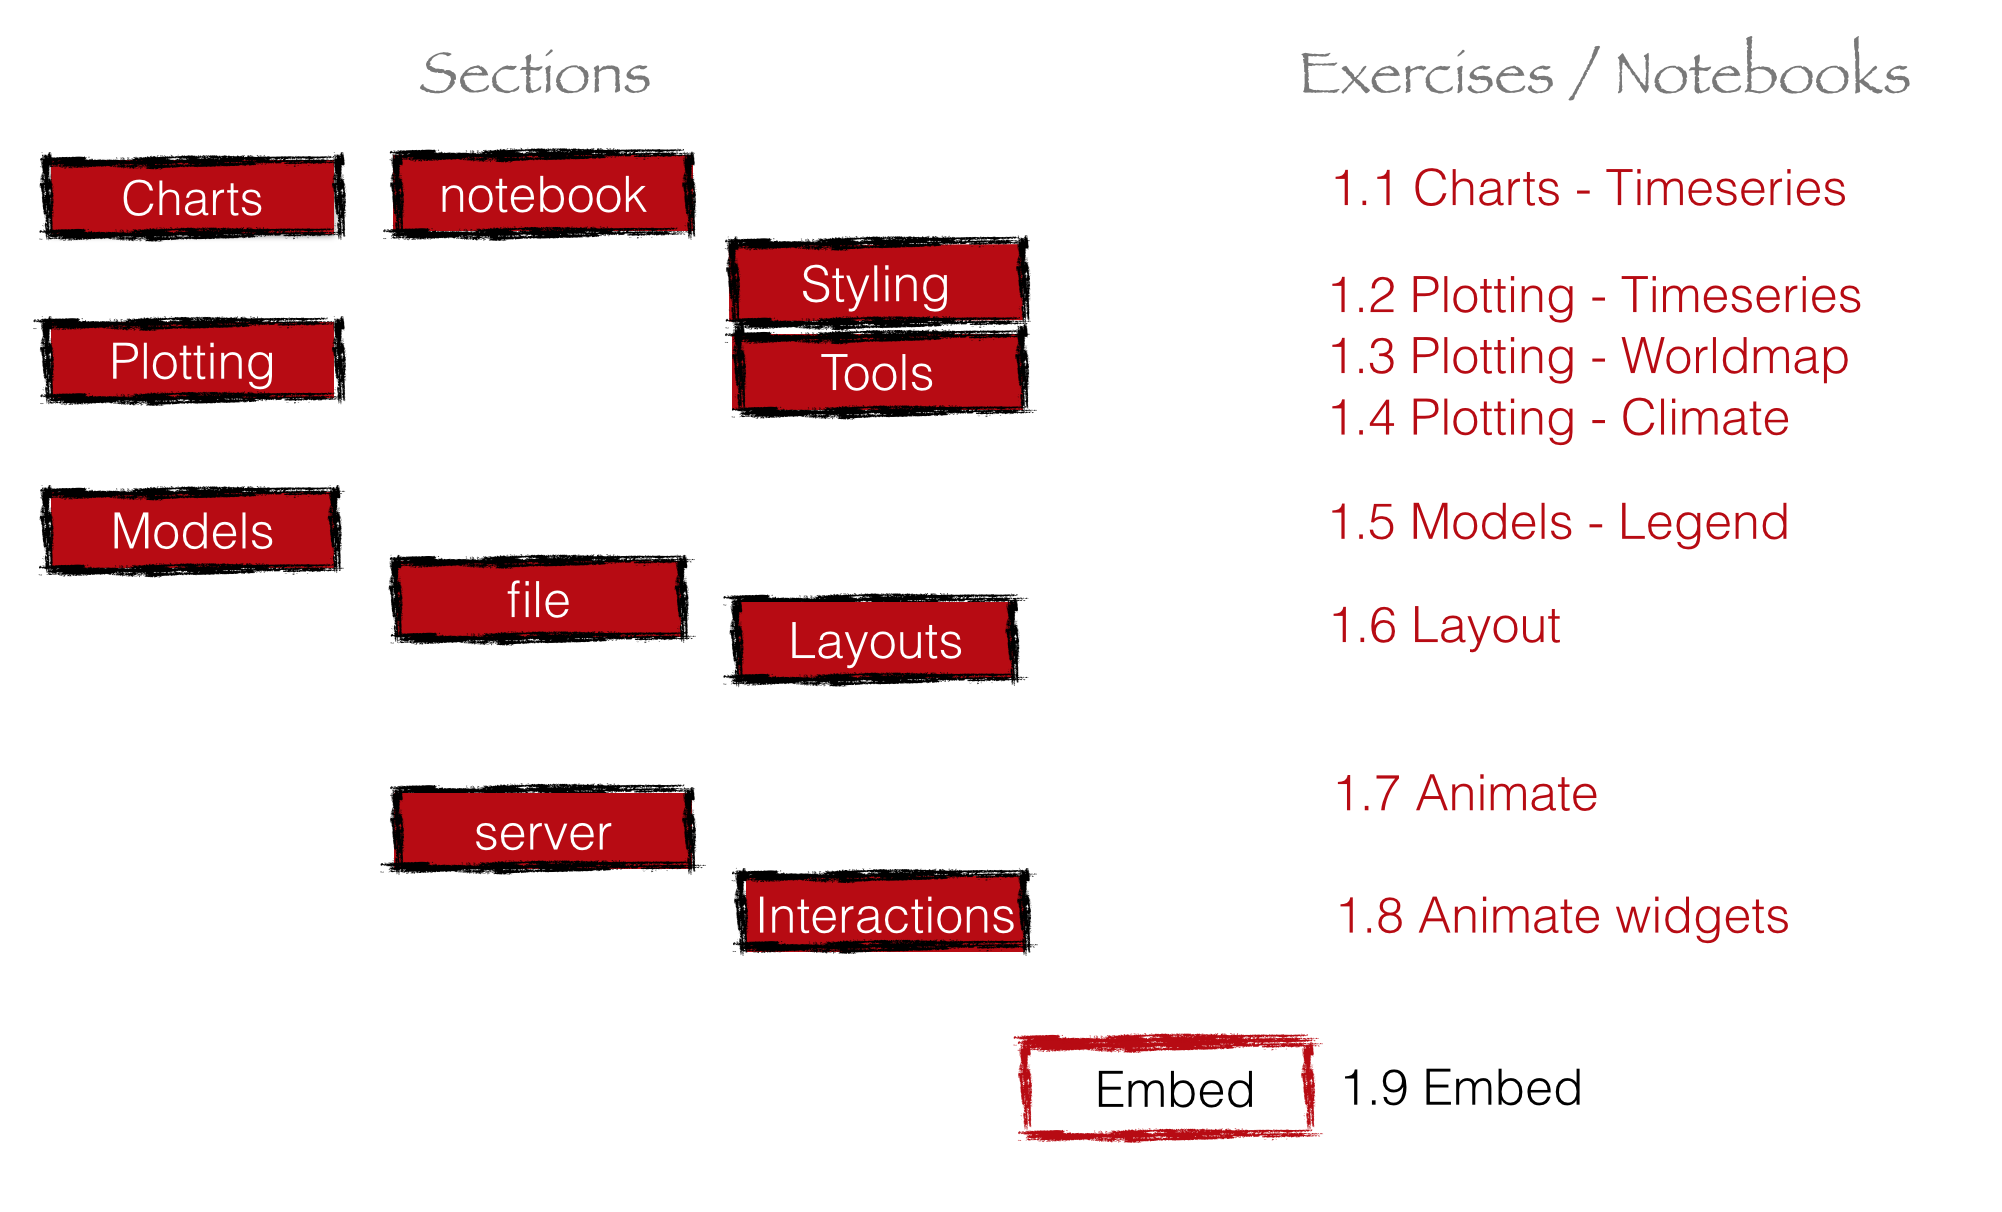
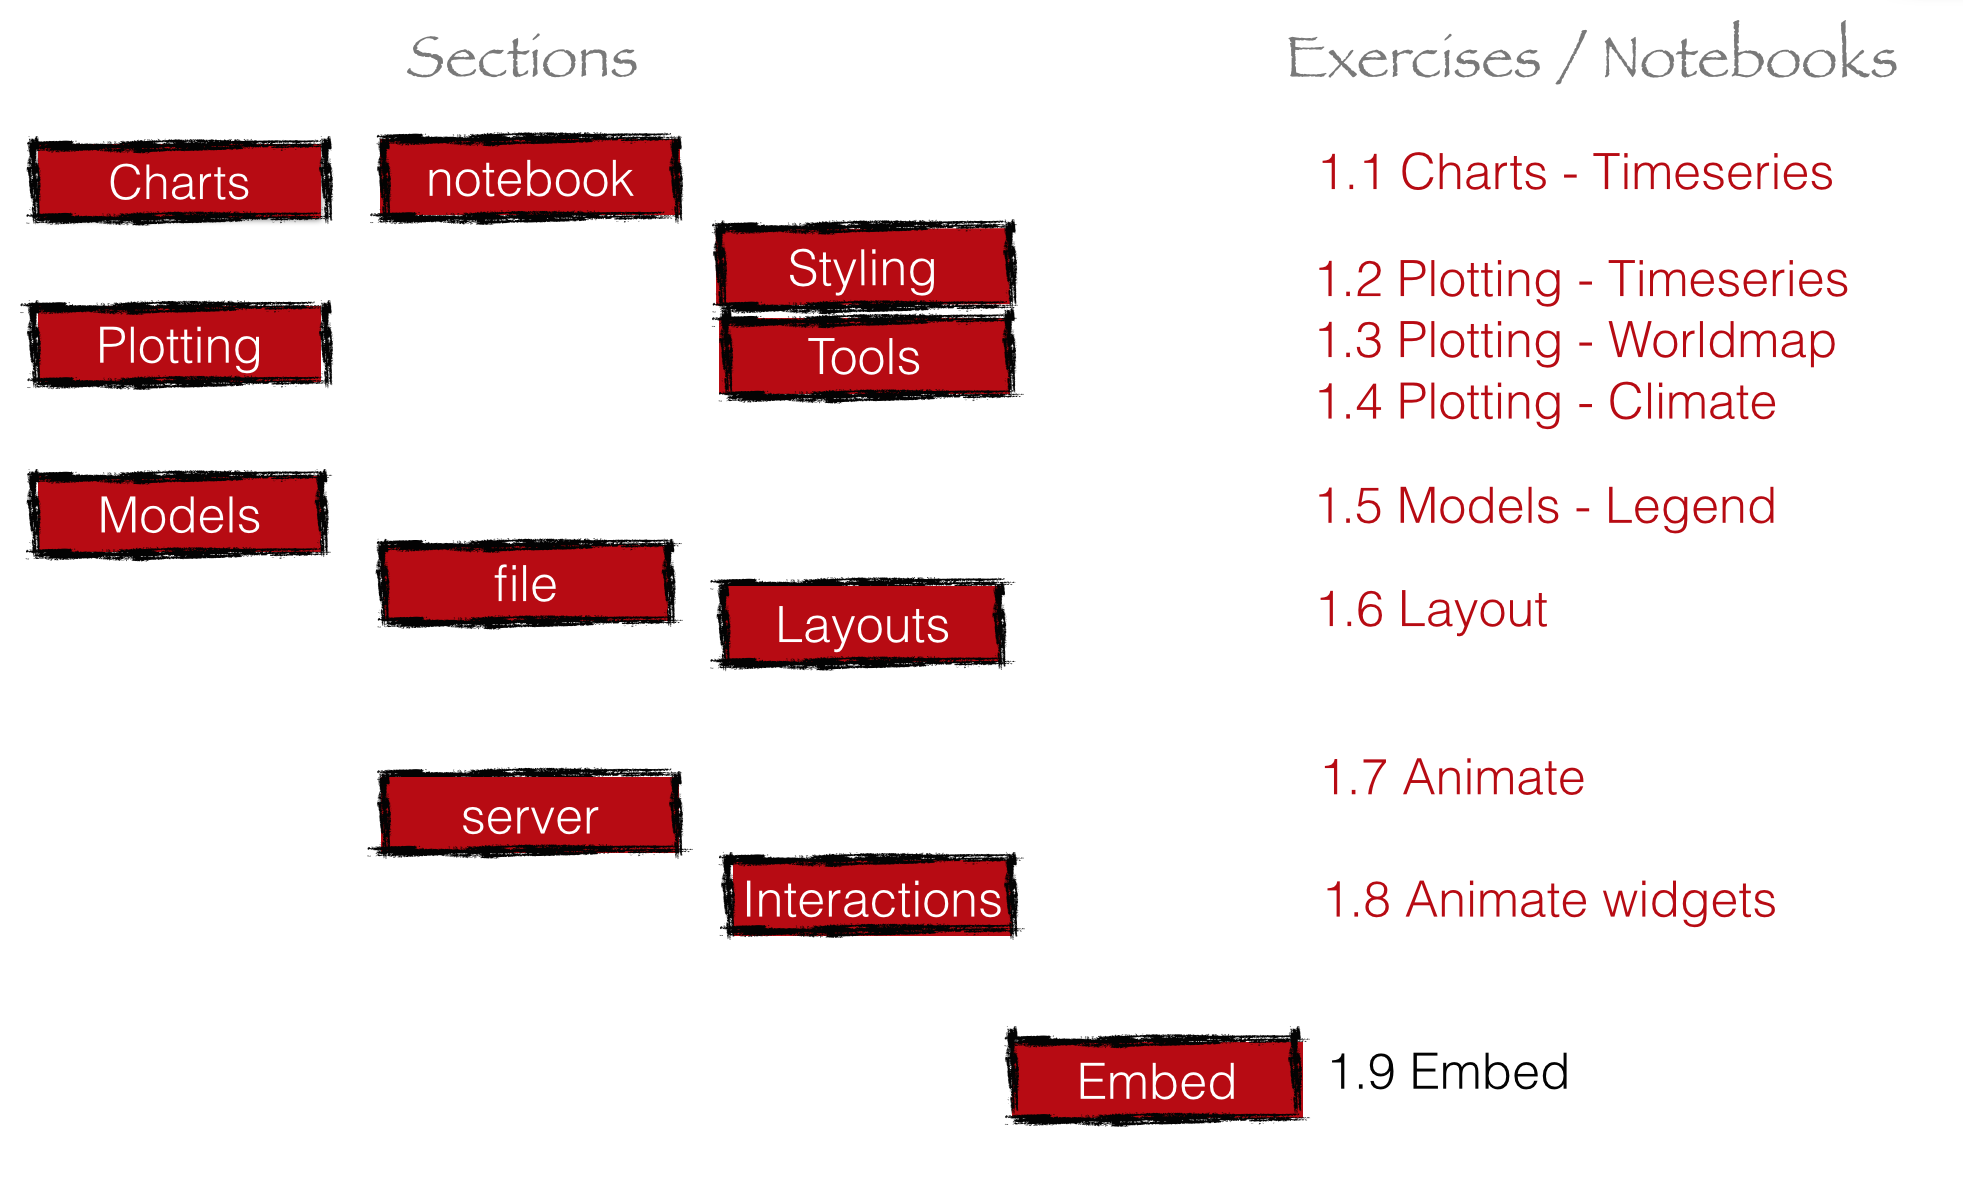
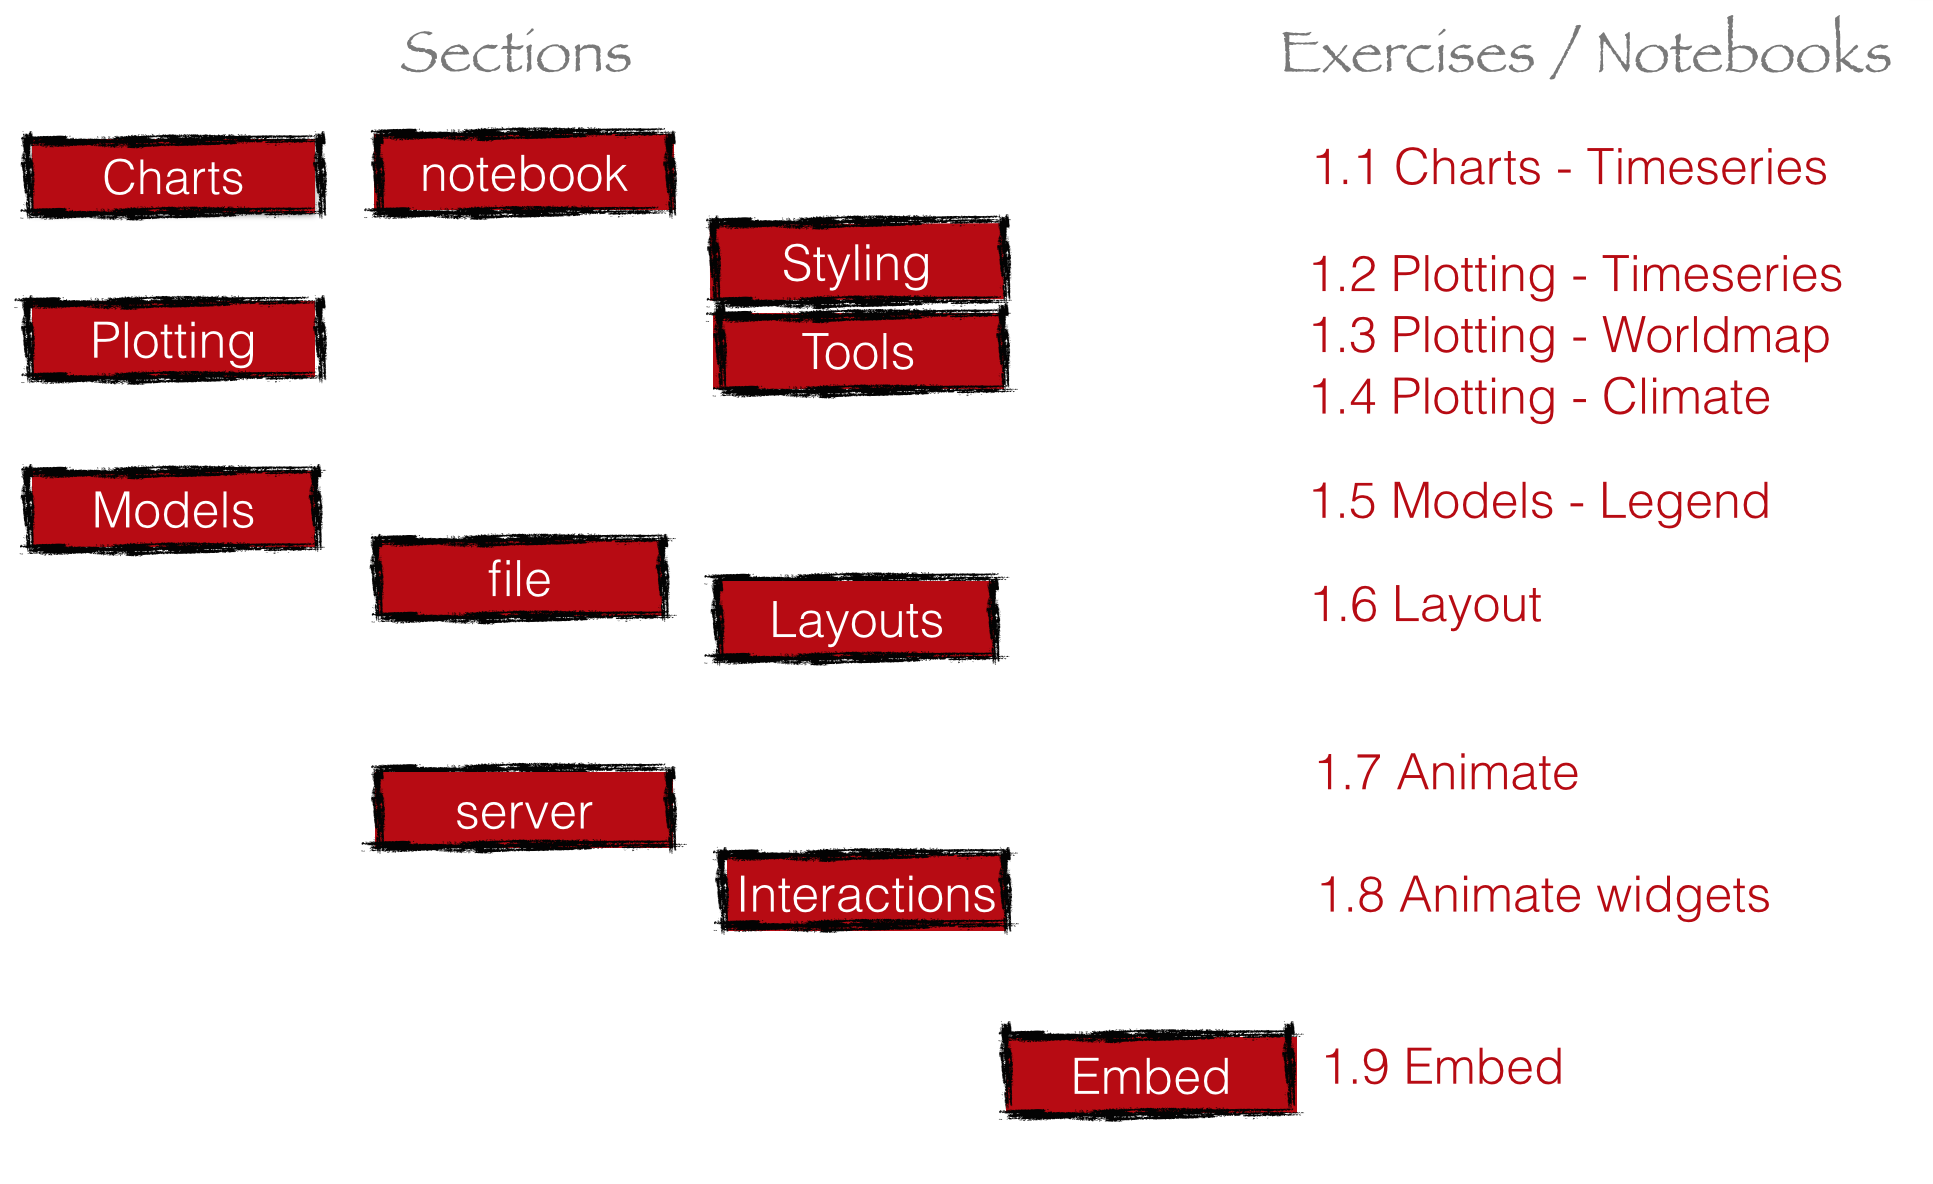
Charts

Resources
http://bokeh.pydata.org/en/latest/docs/user_guide/charts.html
Exercises
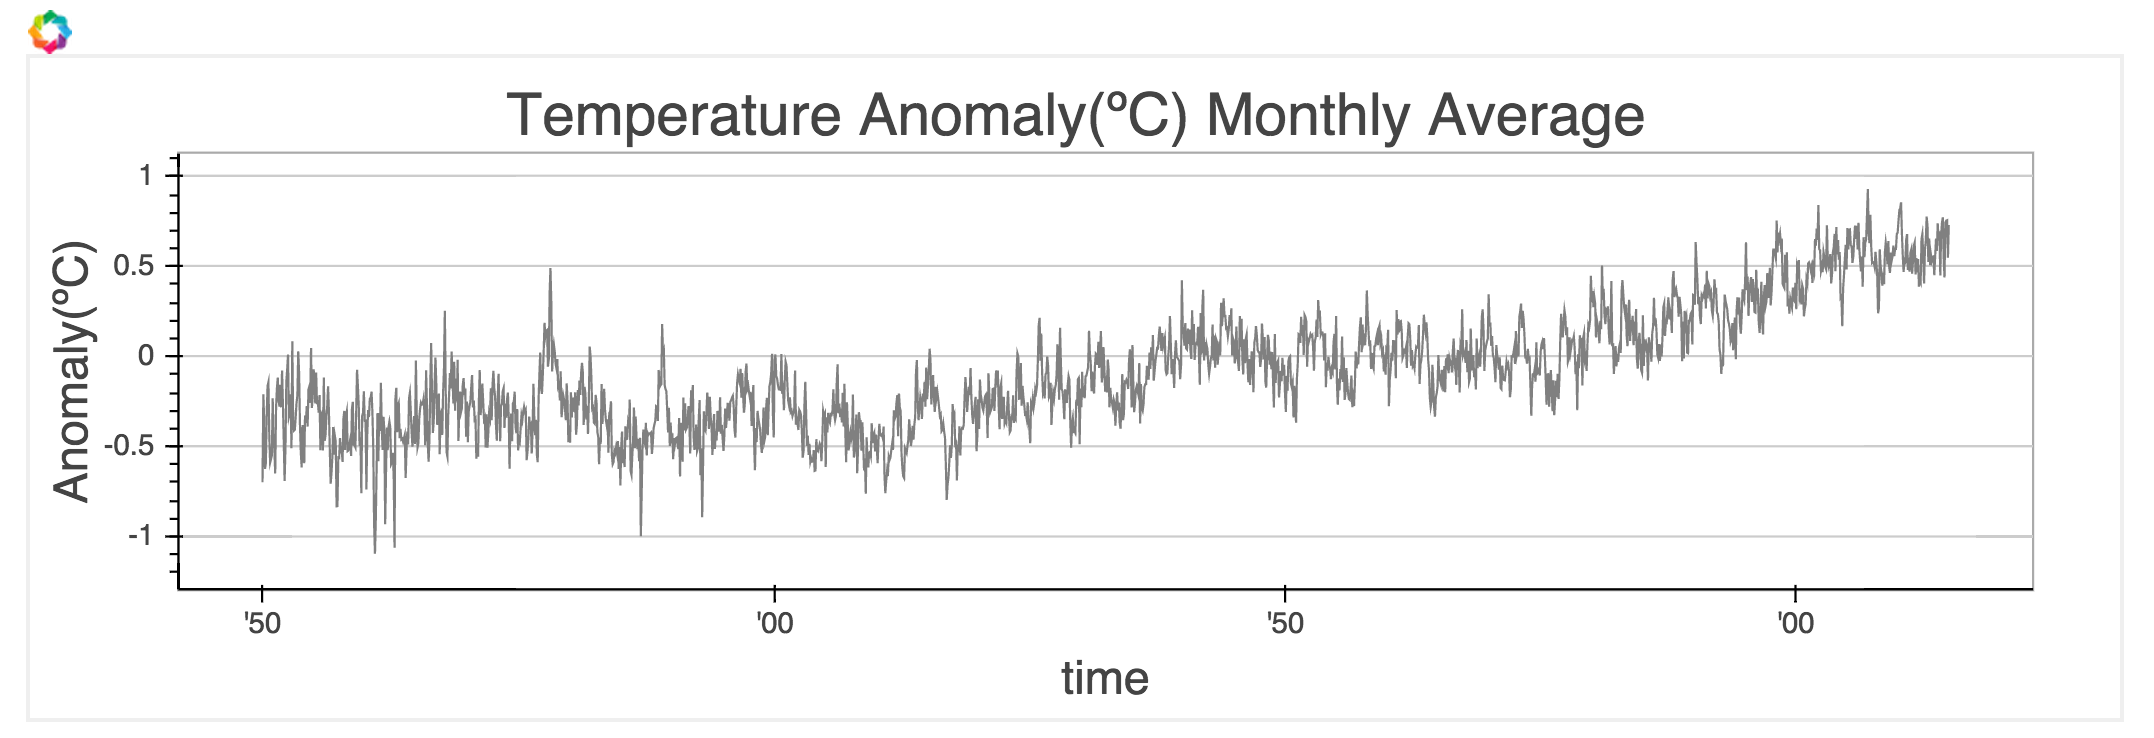
1.1 Charts - Timeseries.ipynb
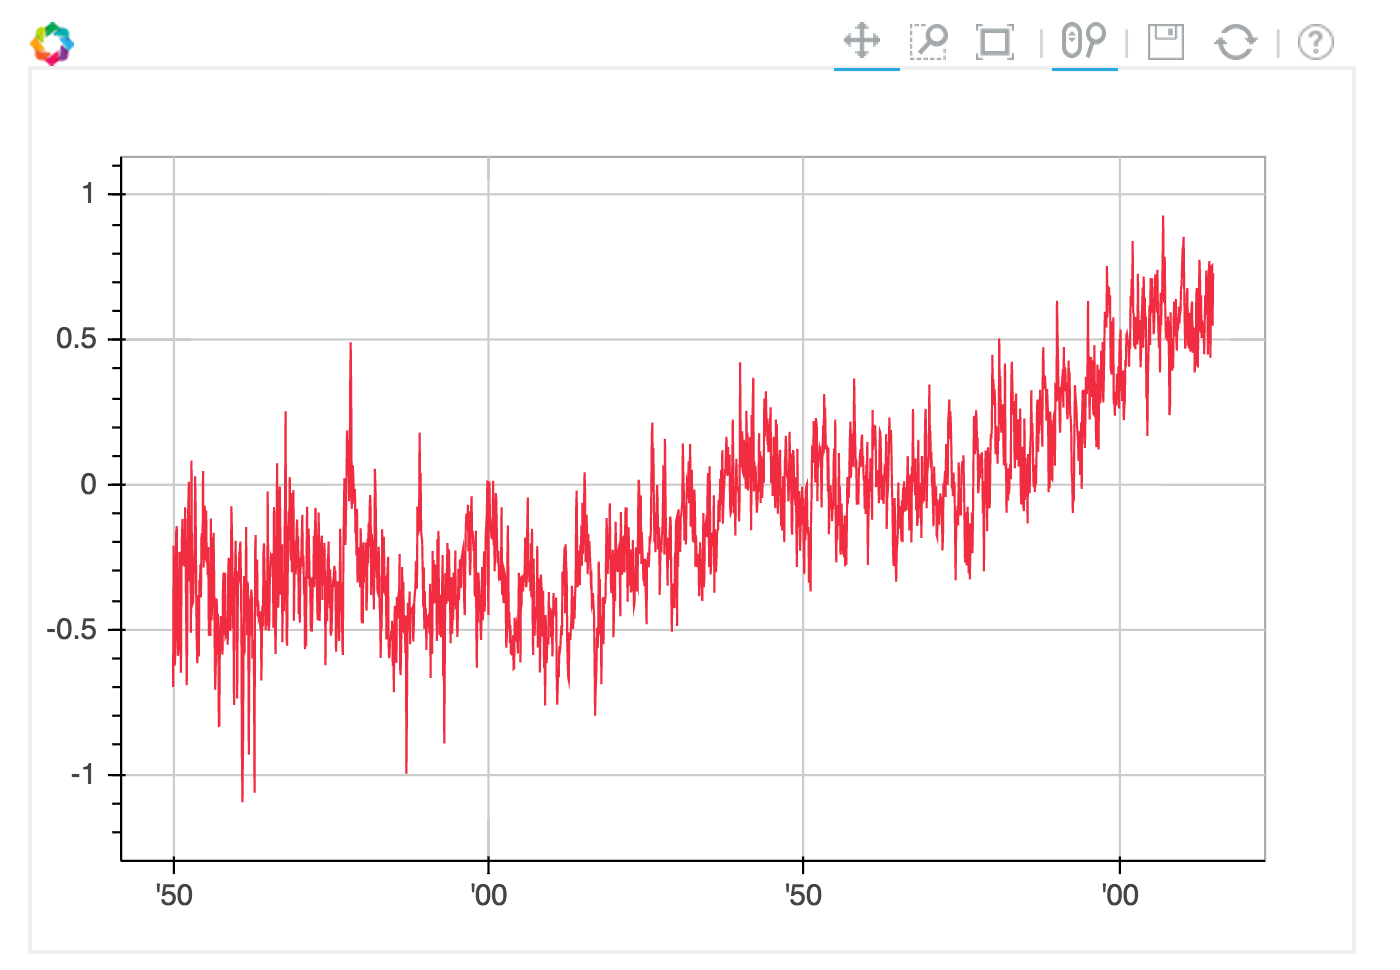
Visualize the evolution of the temperature anomaly monthly average over time with a timeseries chart
5 min
Exercises
1.1 Charts - Timeseries.ipynb
Exercises
1.1 Charts - Timeseries.ipynb
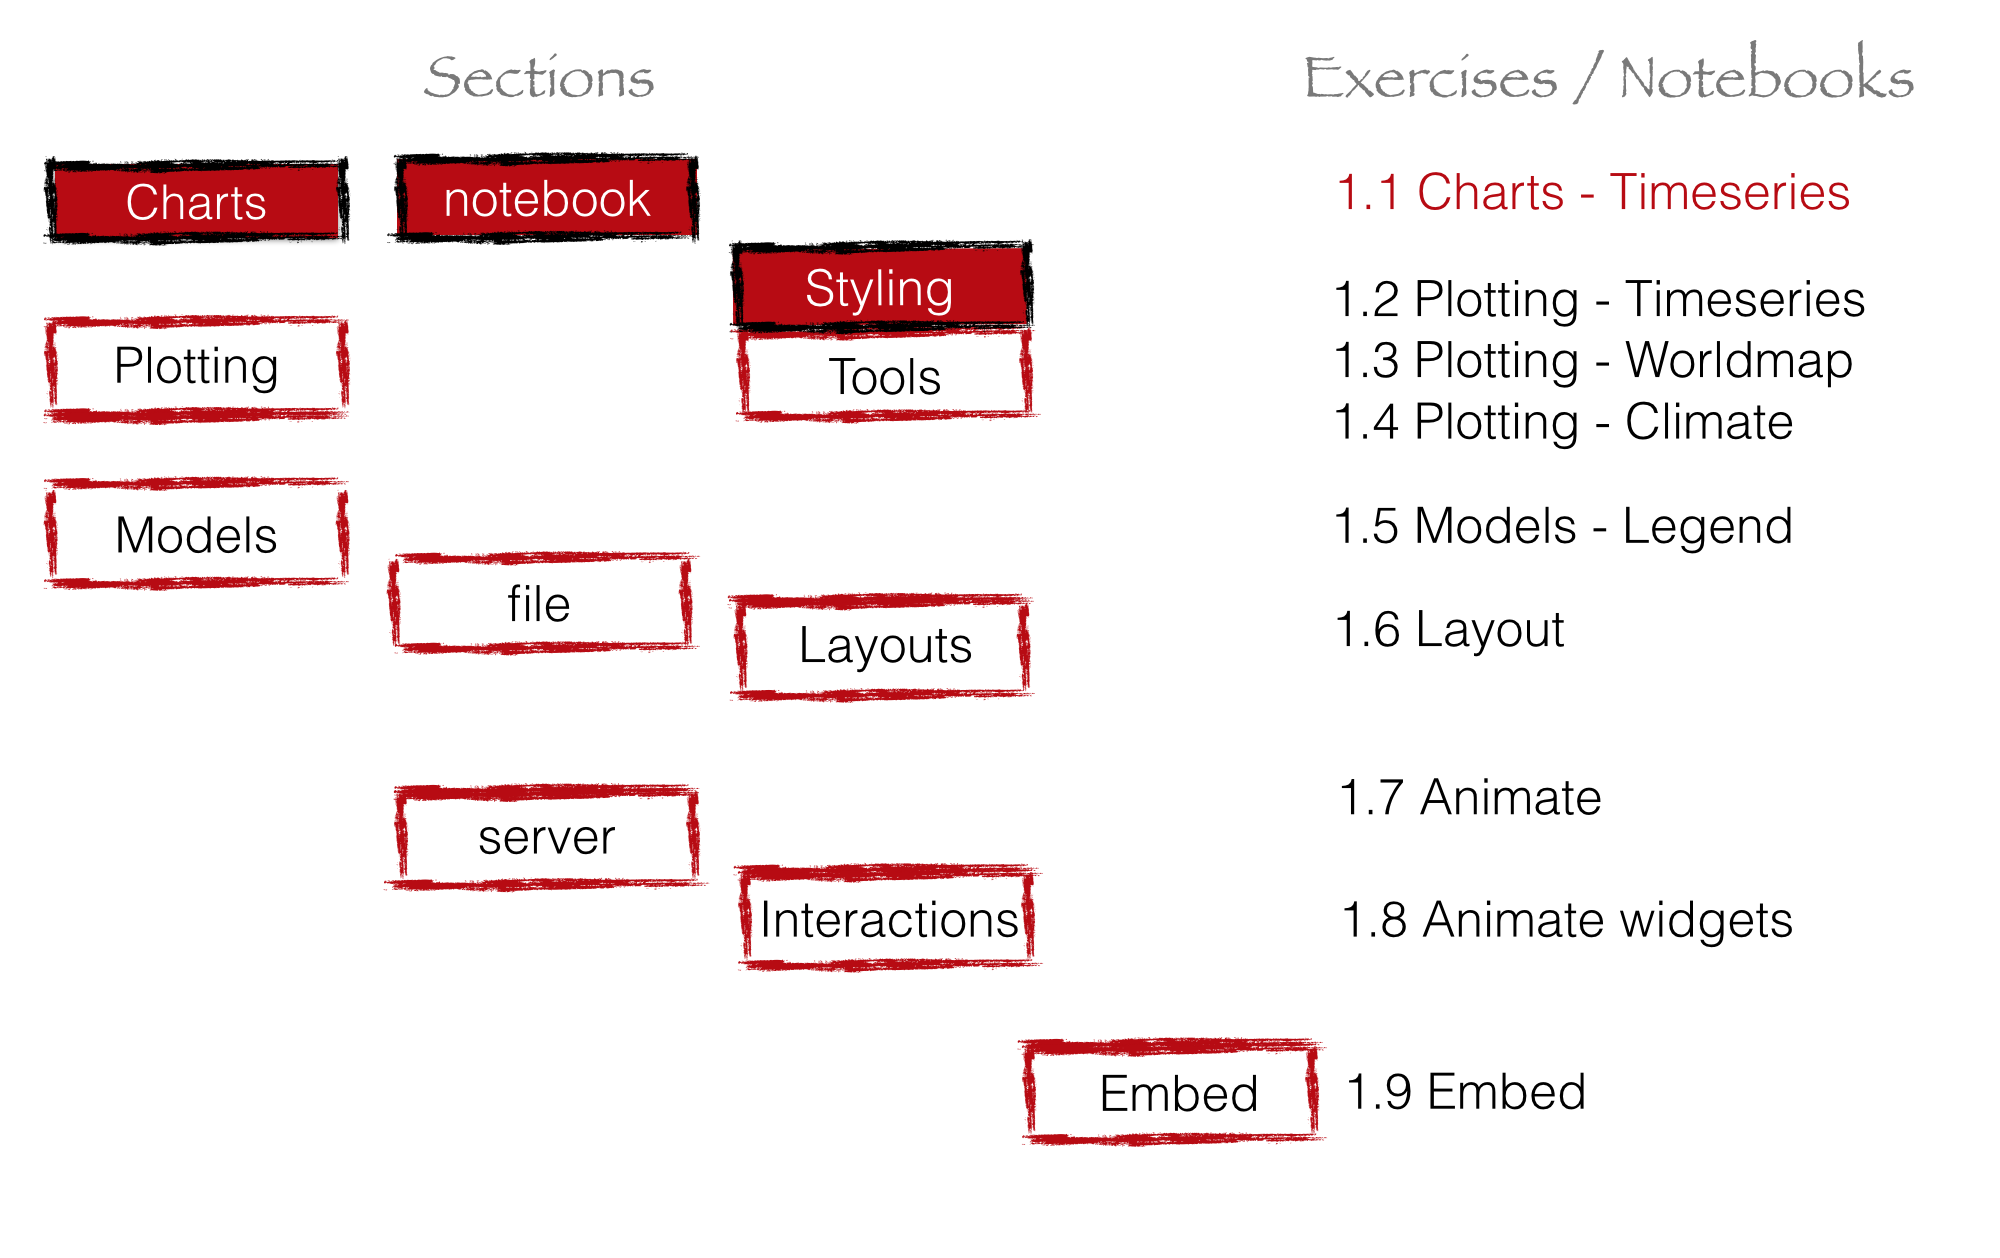
Style your plot
Ideas:
5 min
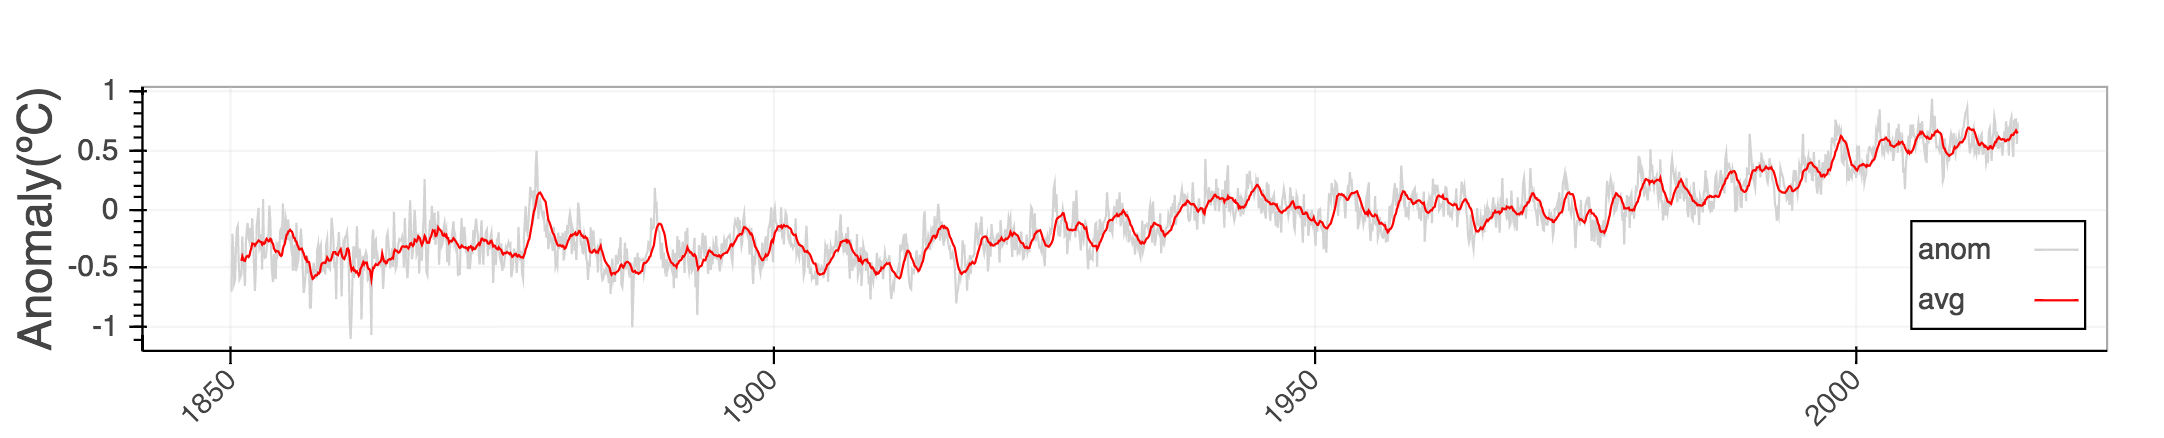
Exercises
1.1 Charts - Timeseries.ipynb
Exercises
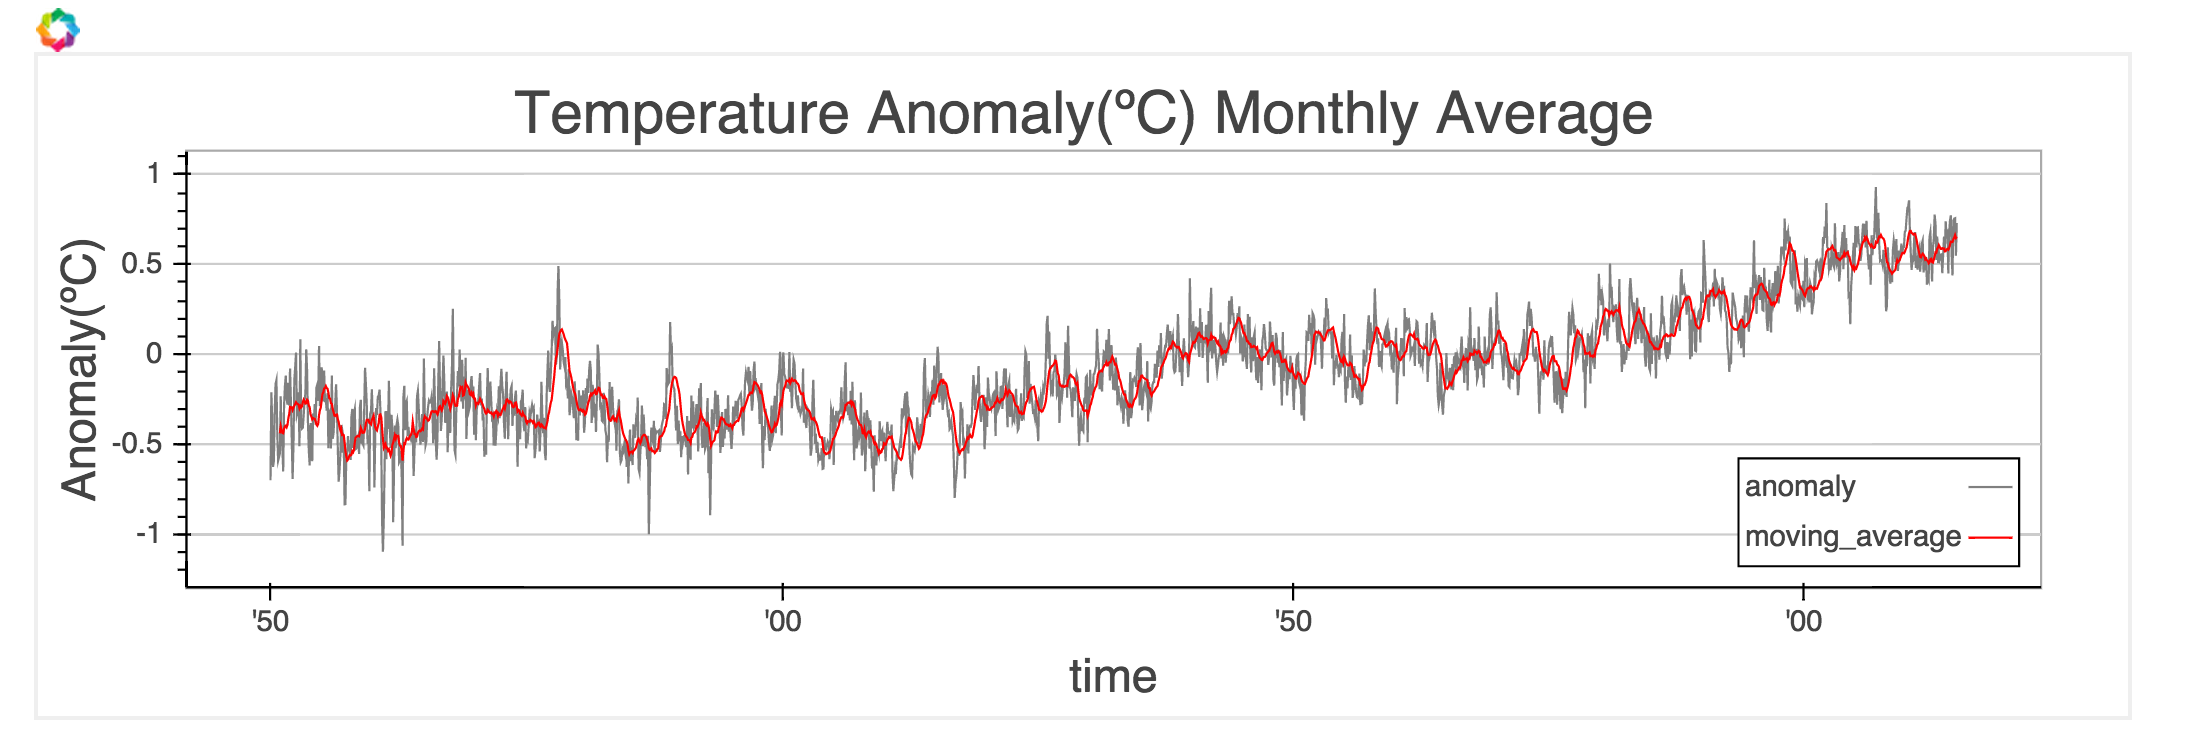
1.1 Charts - Timeseries.ipynb
Add the moving annual average to your chart
5 min
Exercises
1.1 Charts - Timeseries.ipynb
Plotting
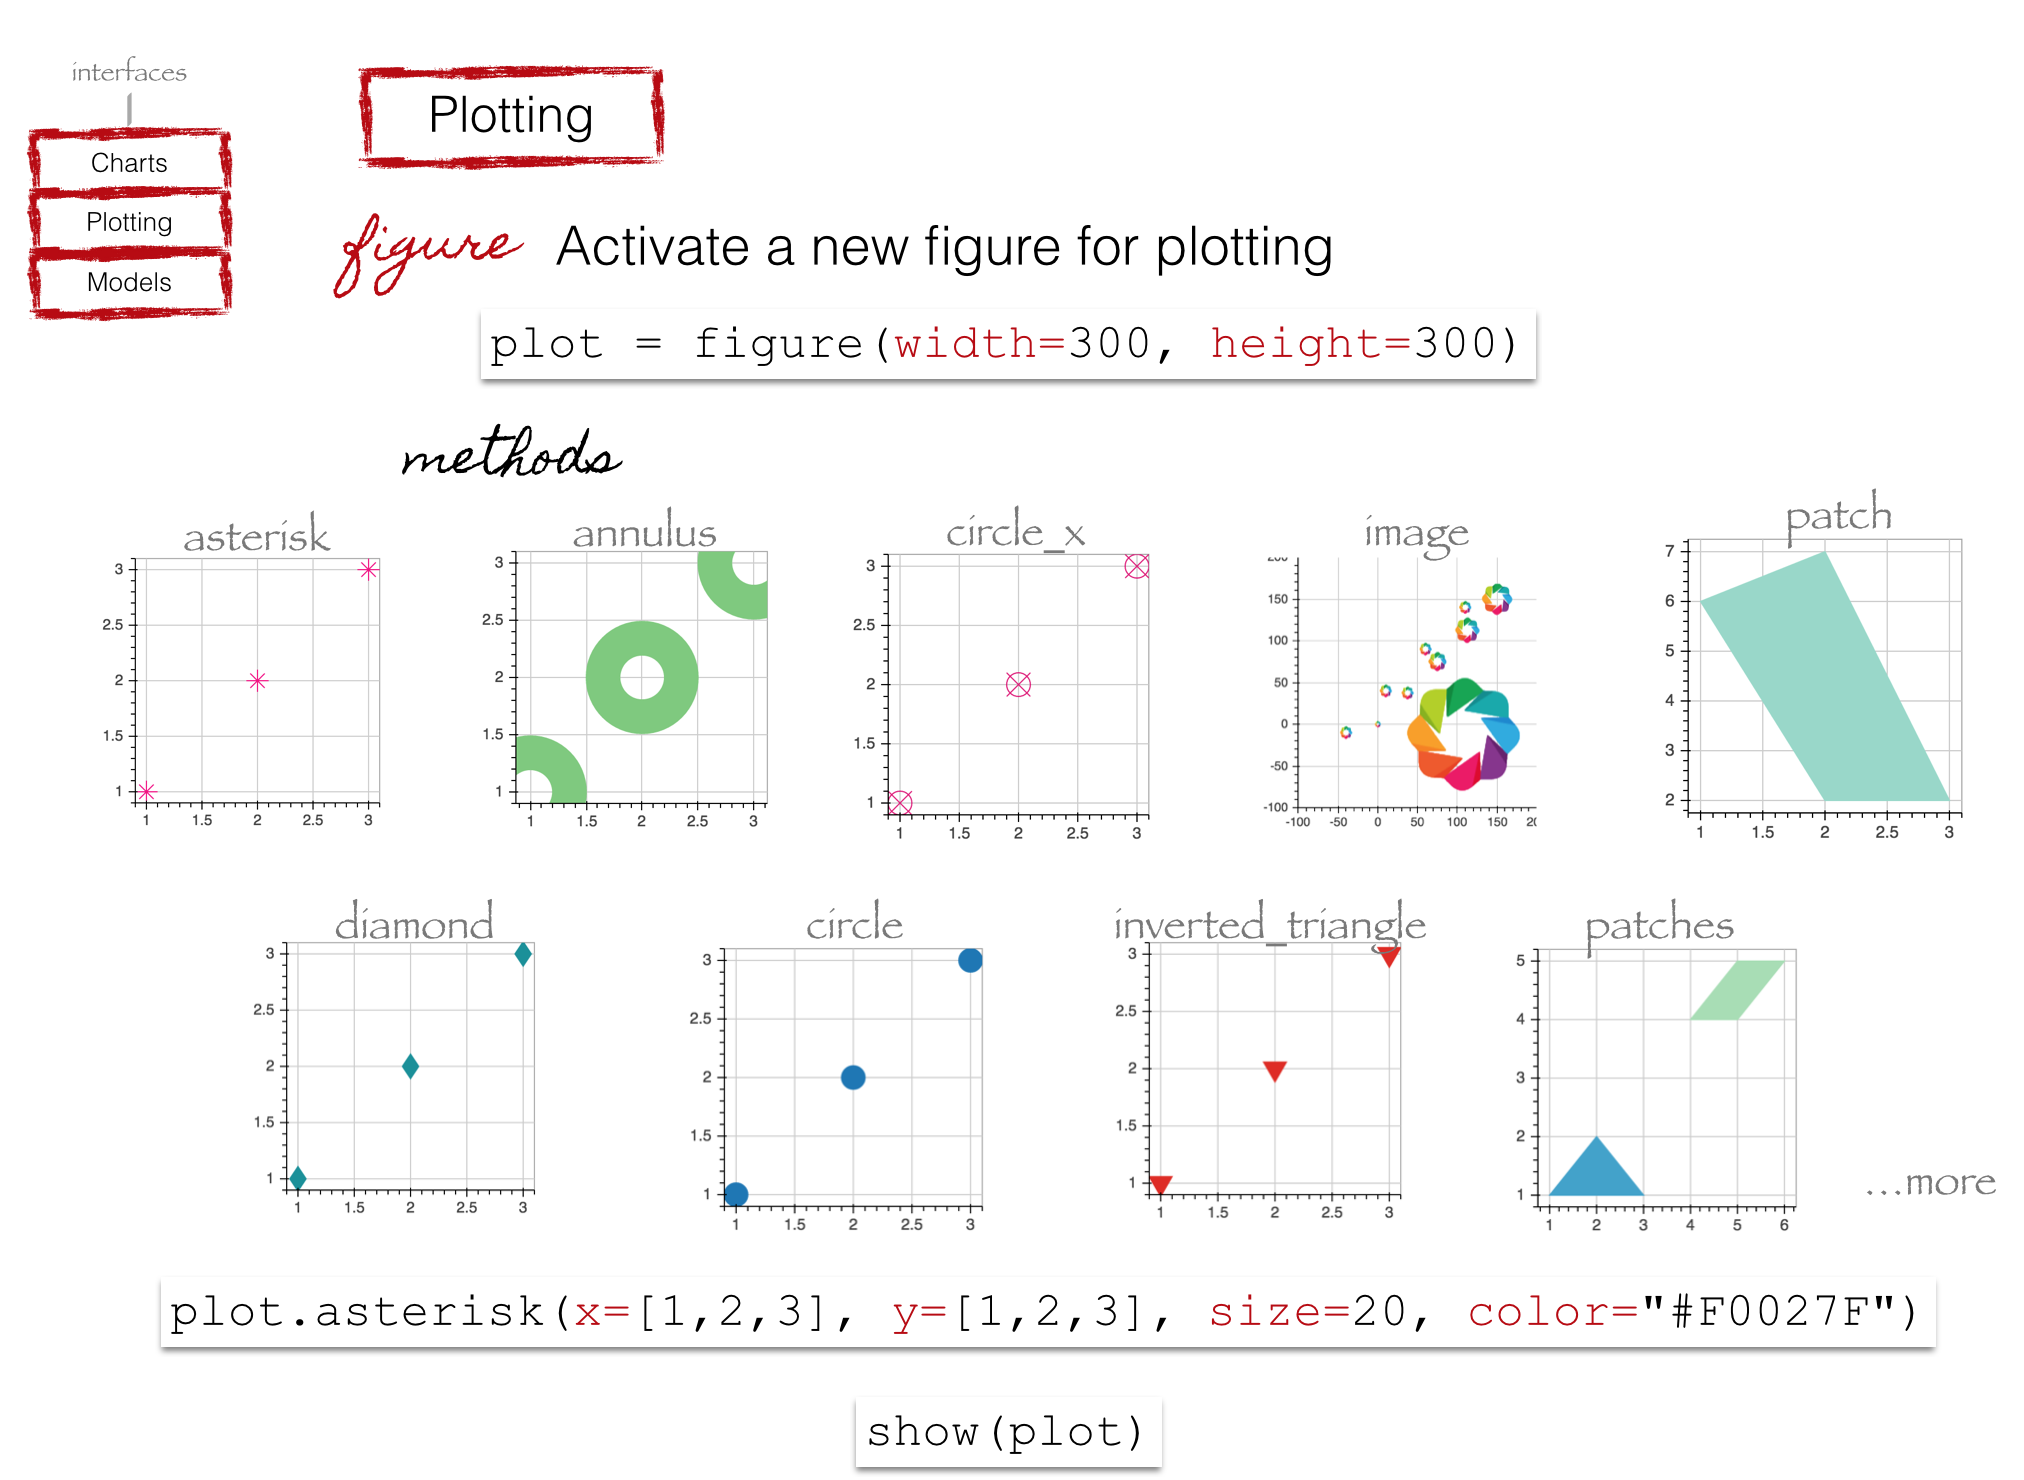
Resources
http://bokeh.pydata.org/en/latest/docs/user_guide/plotting.html
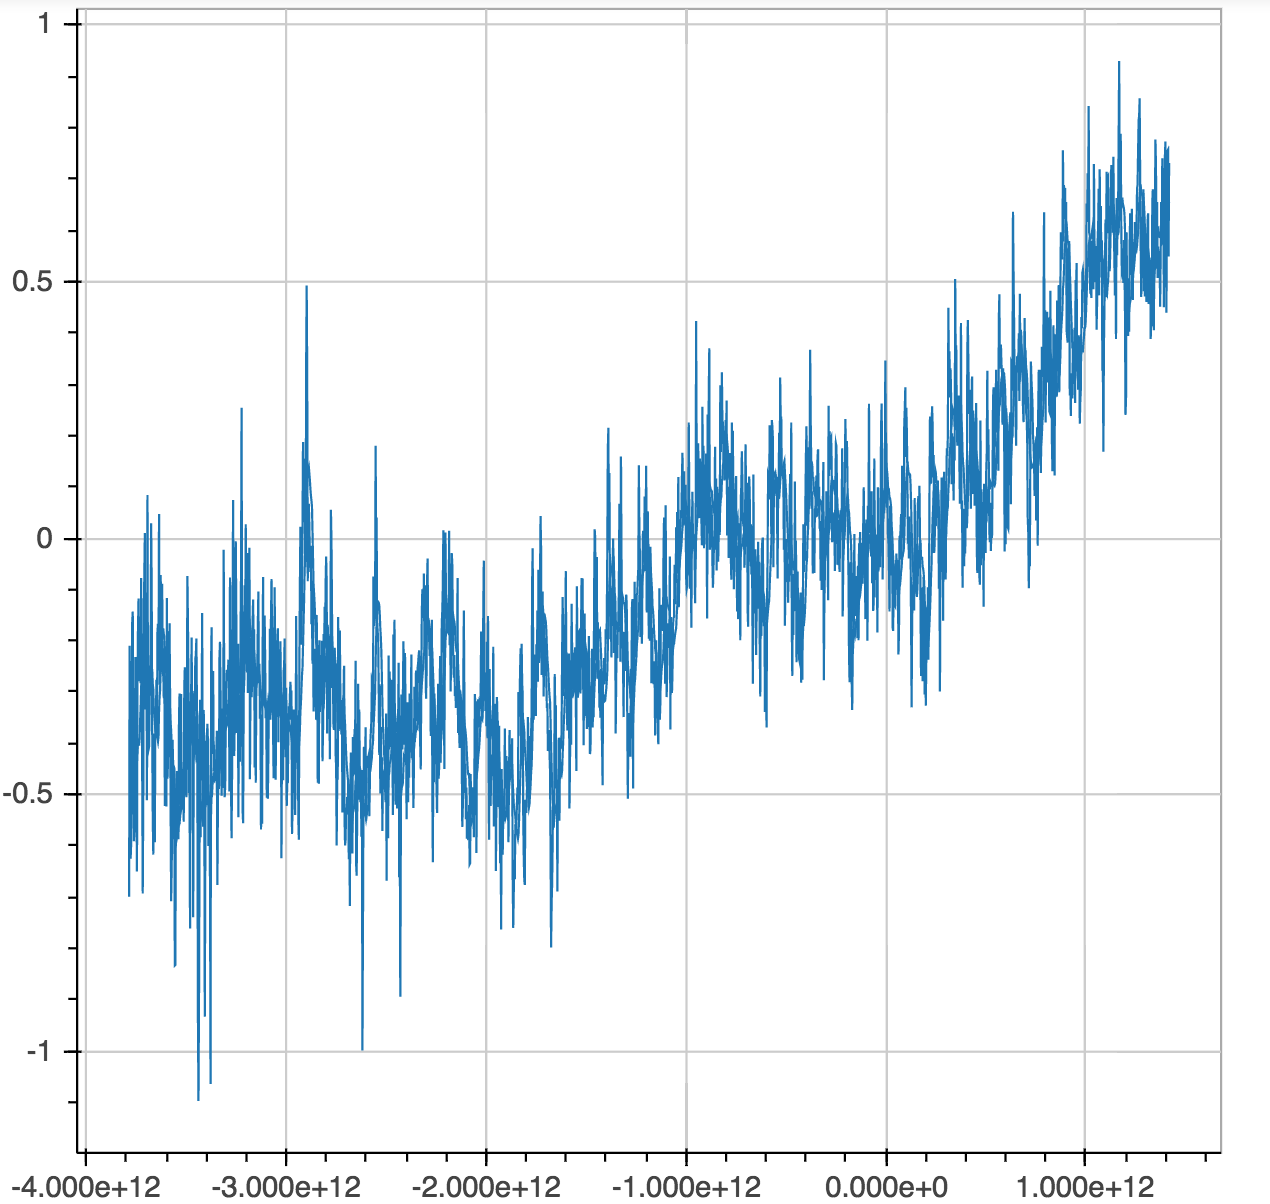
Exercises
1.2 Plotting - Timeseries.ipynb
Reproduce the timeseries chart using the plotting interface
5 min
Exercises
1.2 Plotting - Timeseries.ipynb
Plotting - Styling
http://bokeh.pydata.org/en/latest/docs/user_guide/styling.html
Exercises
1.2 Plotting - Timeseries.ipynb
Style the plot appropriately
10 min
Exercises
1.2 Plotting - Timeseries.ipynb
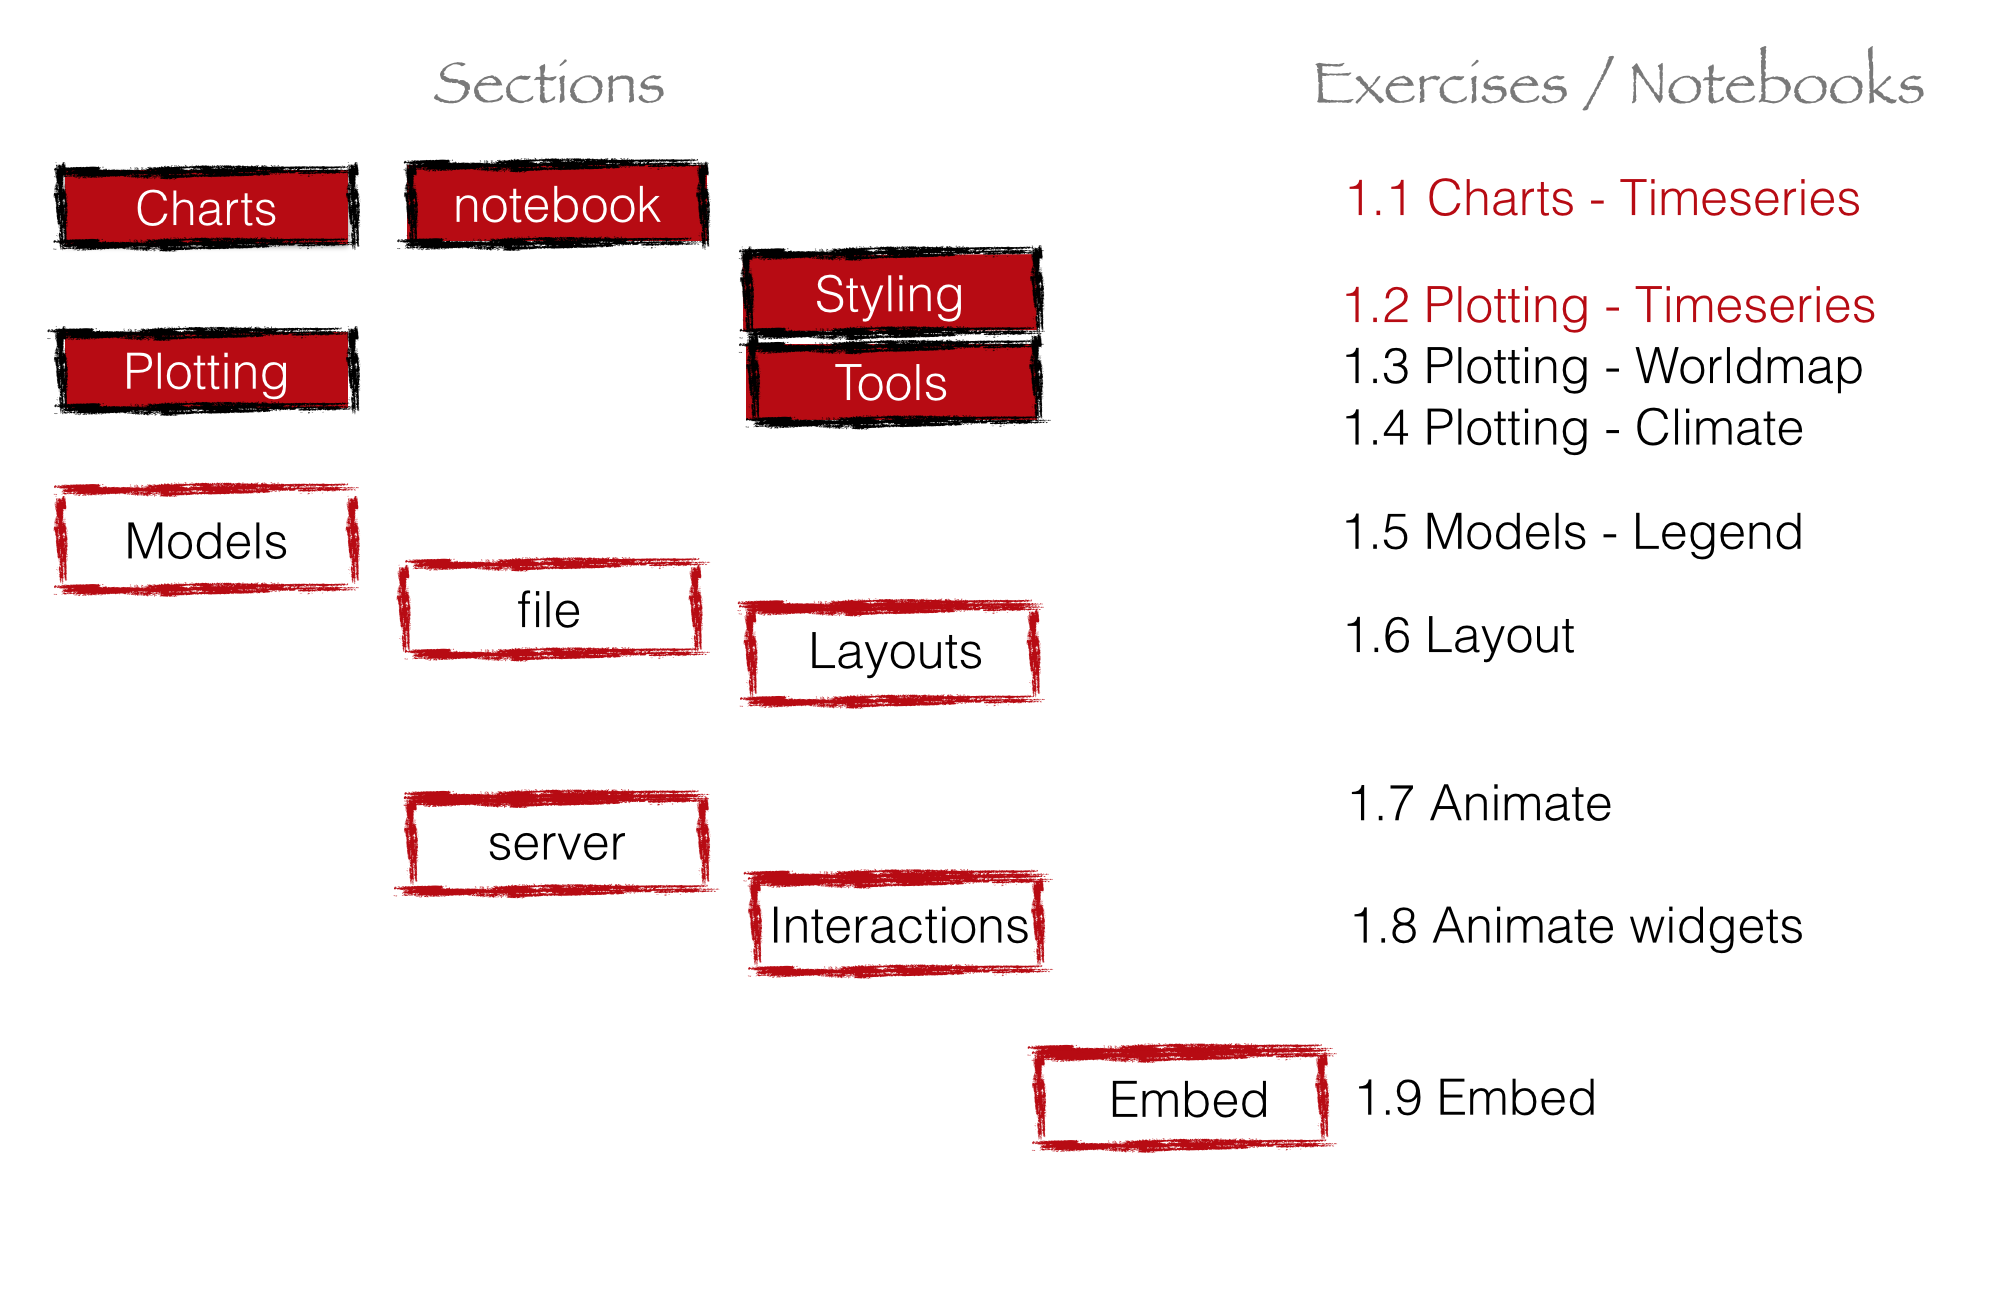
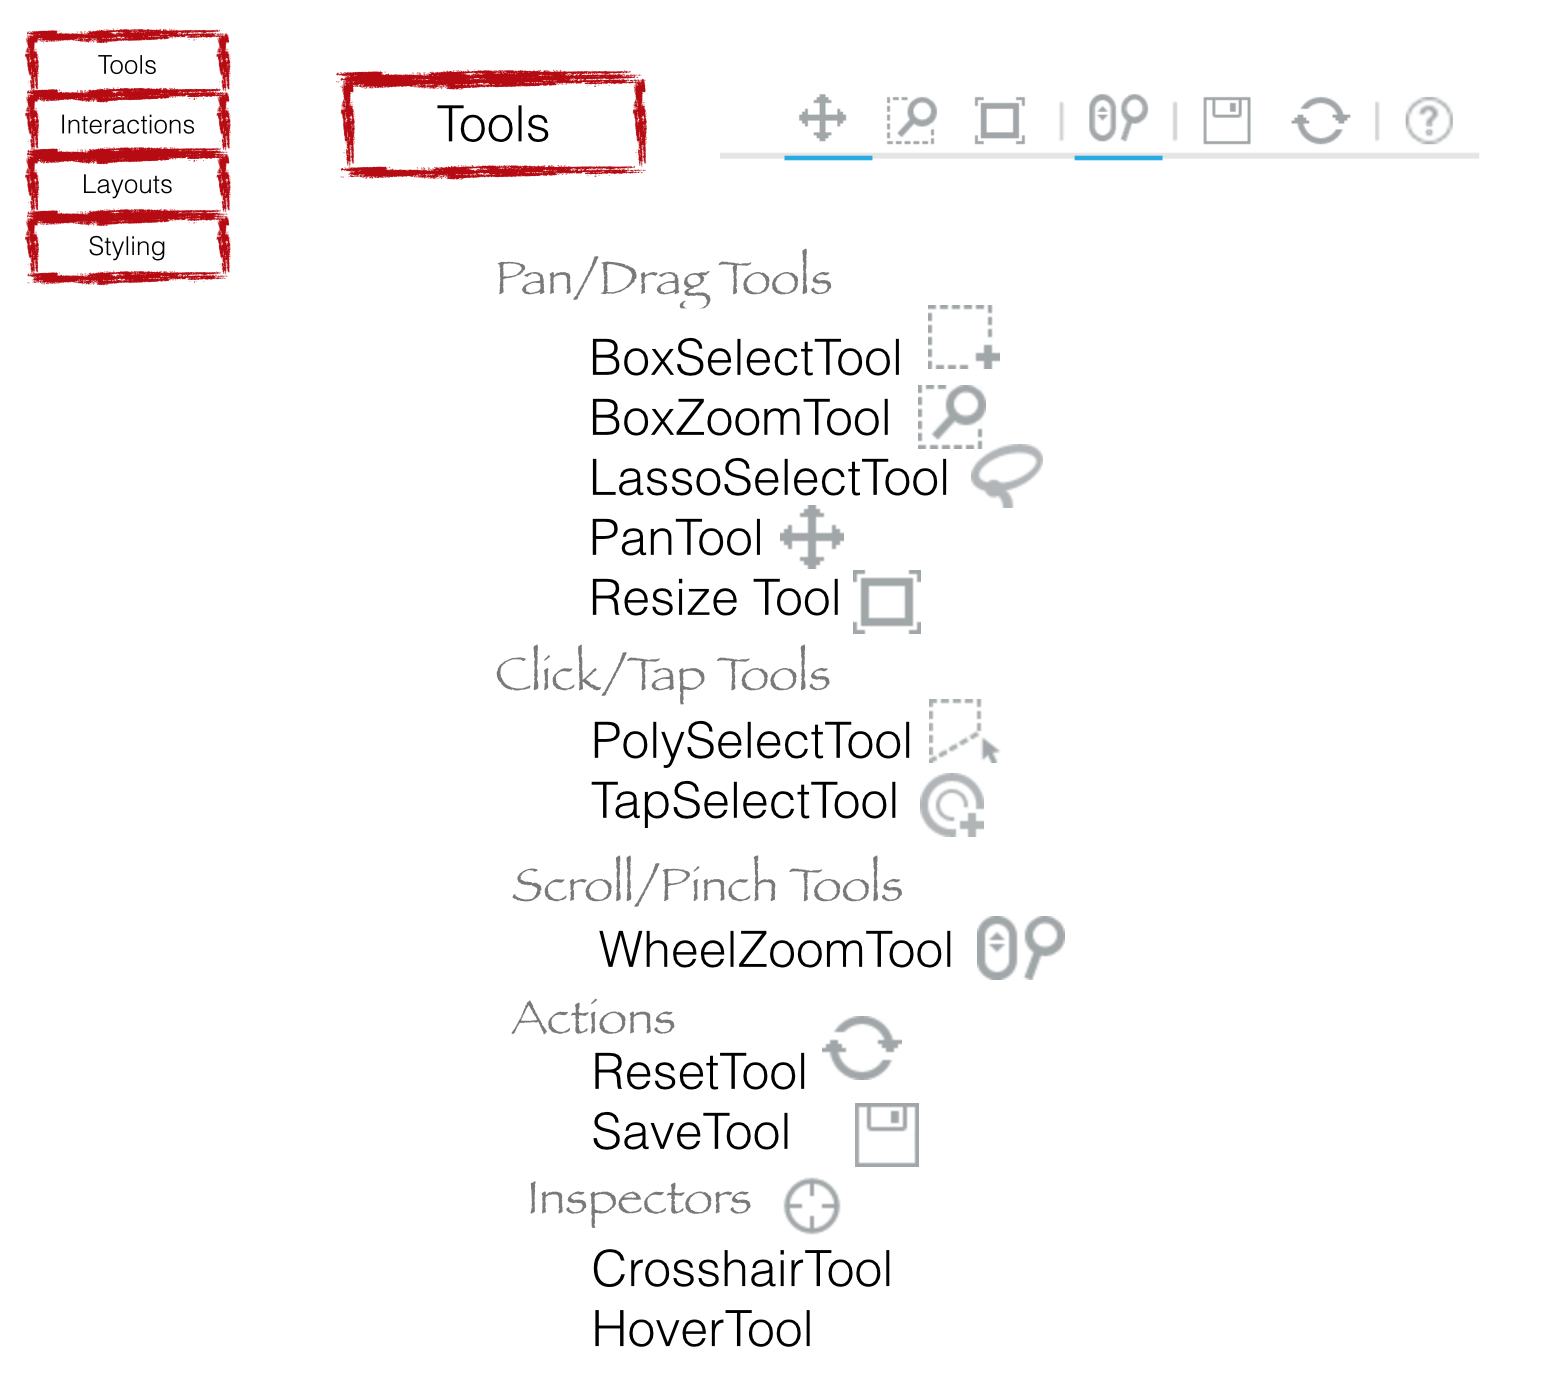
Plotting - Tools
http://bokeh.pydata.org/en/latest/docs/user_guide/tools.html
Exercises
1.2 Plotting - Timeseries.ipynb
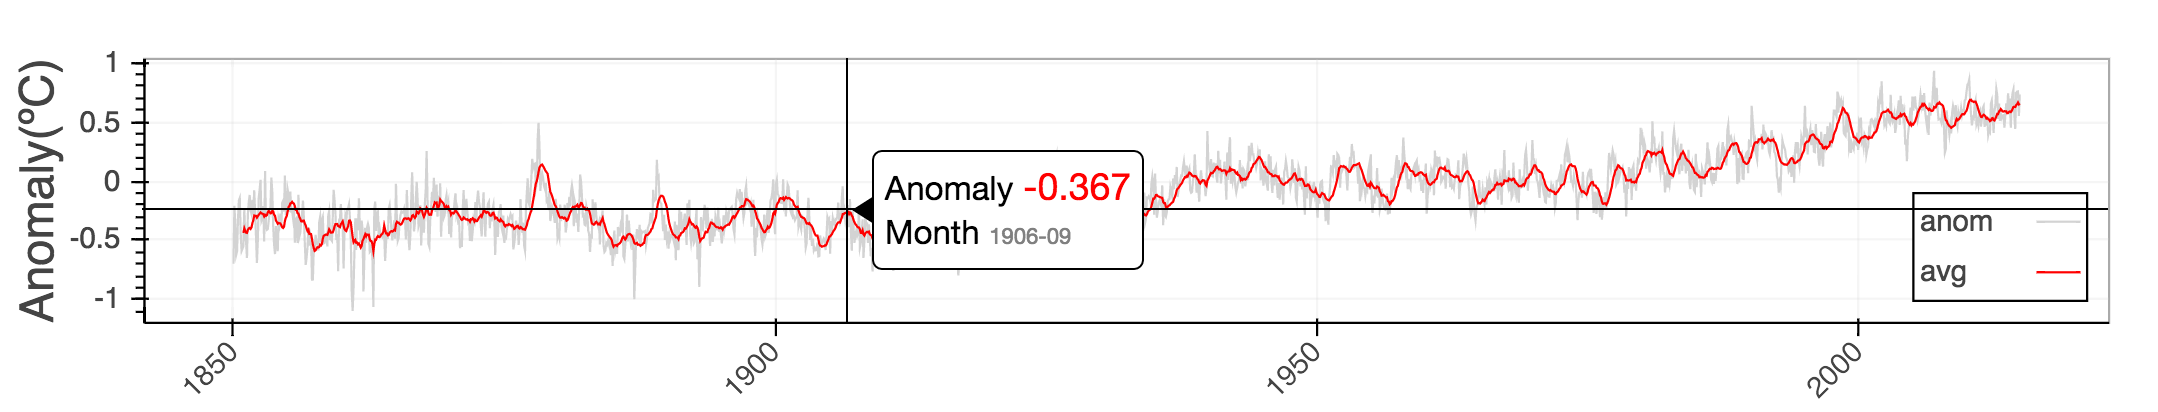
Add a crosshair and hover tool to the plot
10 min
Exercises
1.2 Plotting - Timeseries.ipynb
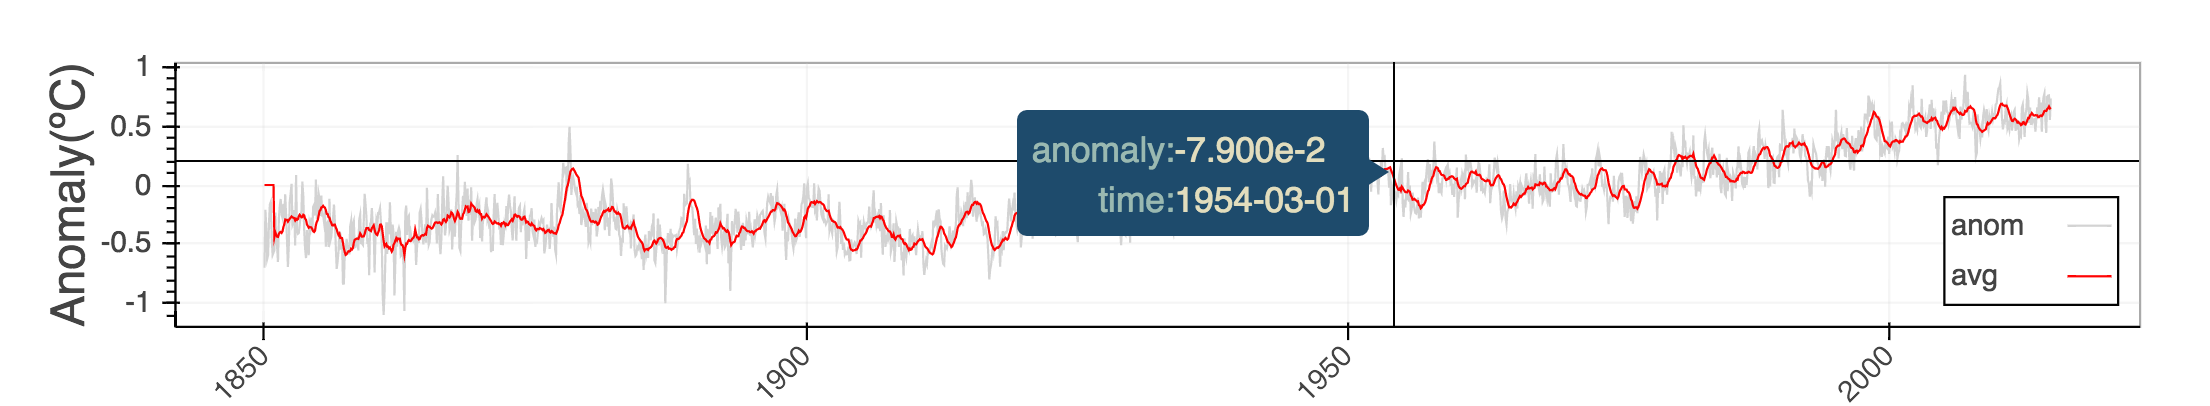
Exercises
1.2 Plotting - Timeseries.ipynb
[OPTIONAL] Style the hover tooltip
5 min
Exercises
1.2 Plotting - Timeseries.ipynb
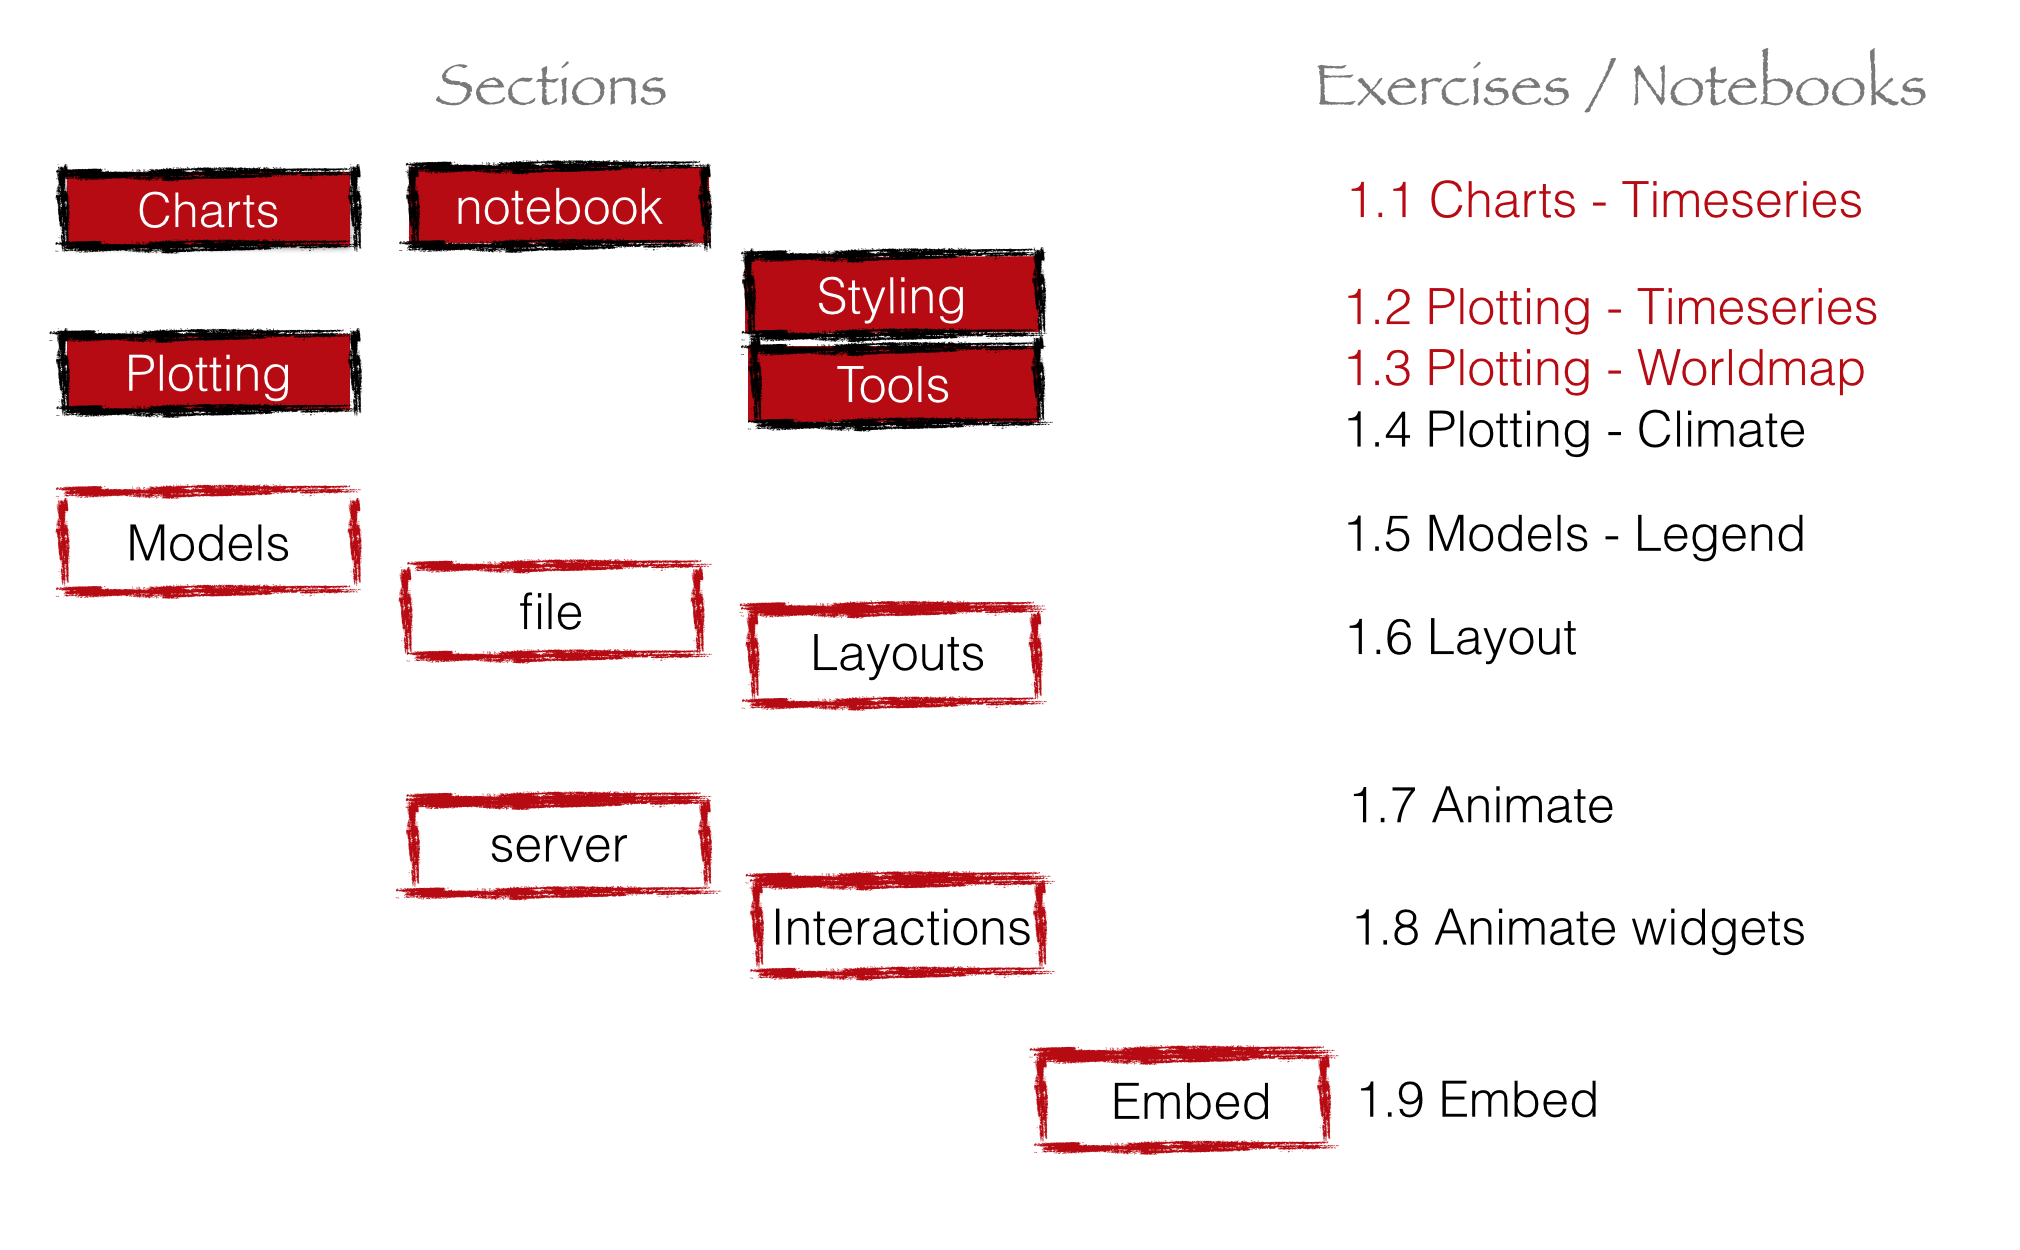
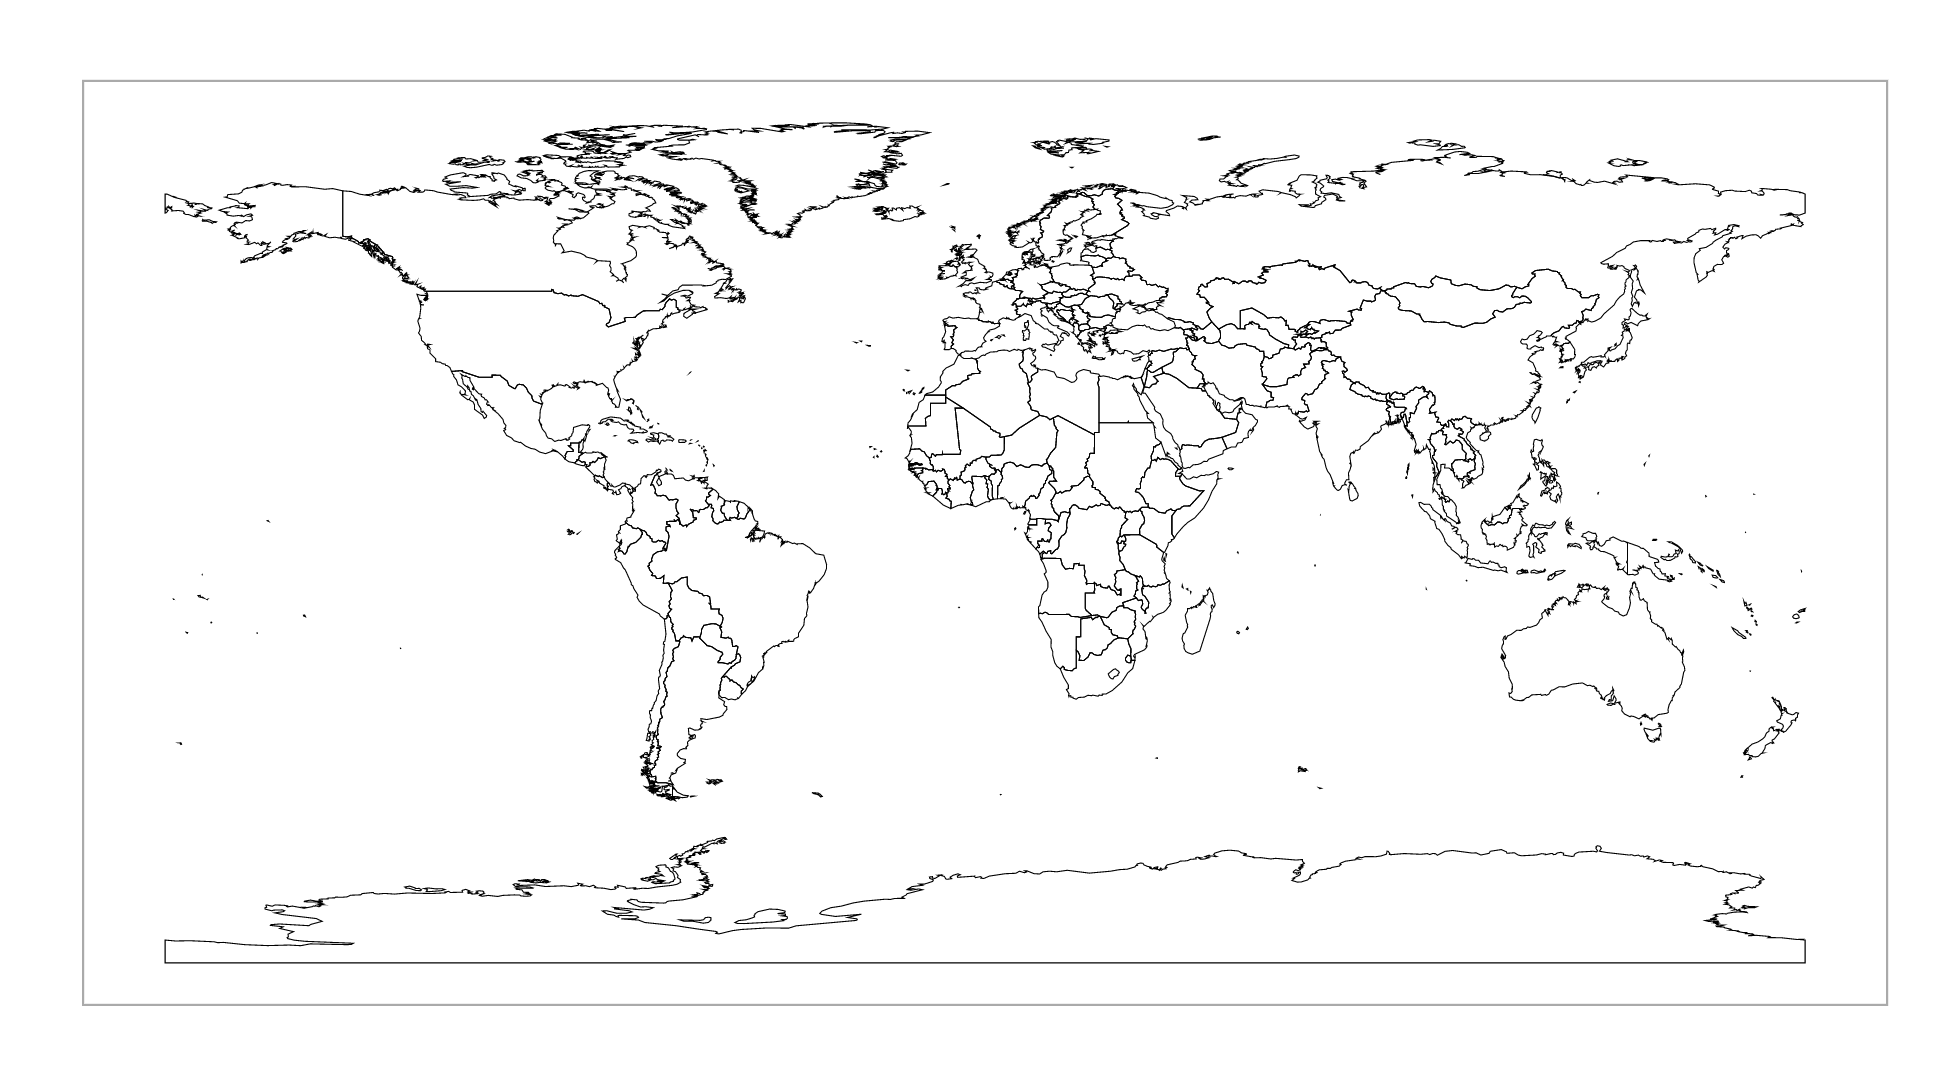
Exercises
1.3 Plotting - Worldmap.ipynb
Draw a worldmap with the plotting interface
5 min
Exercises
1.3 Plotting - Worldmap.ipynb
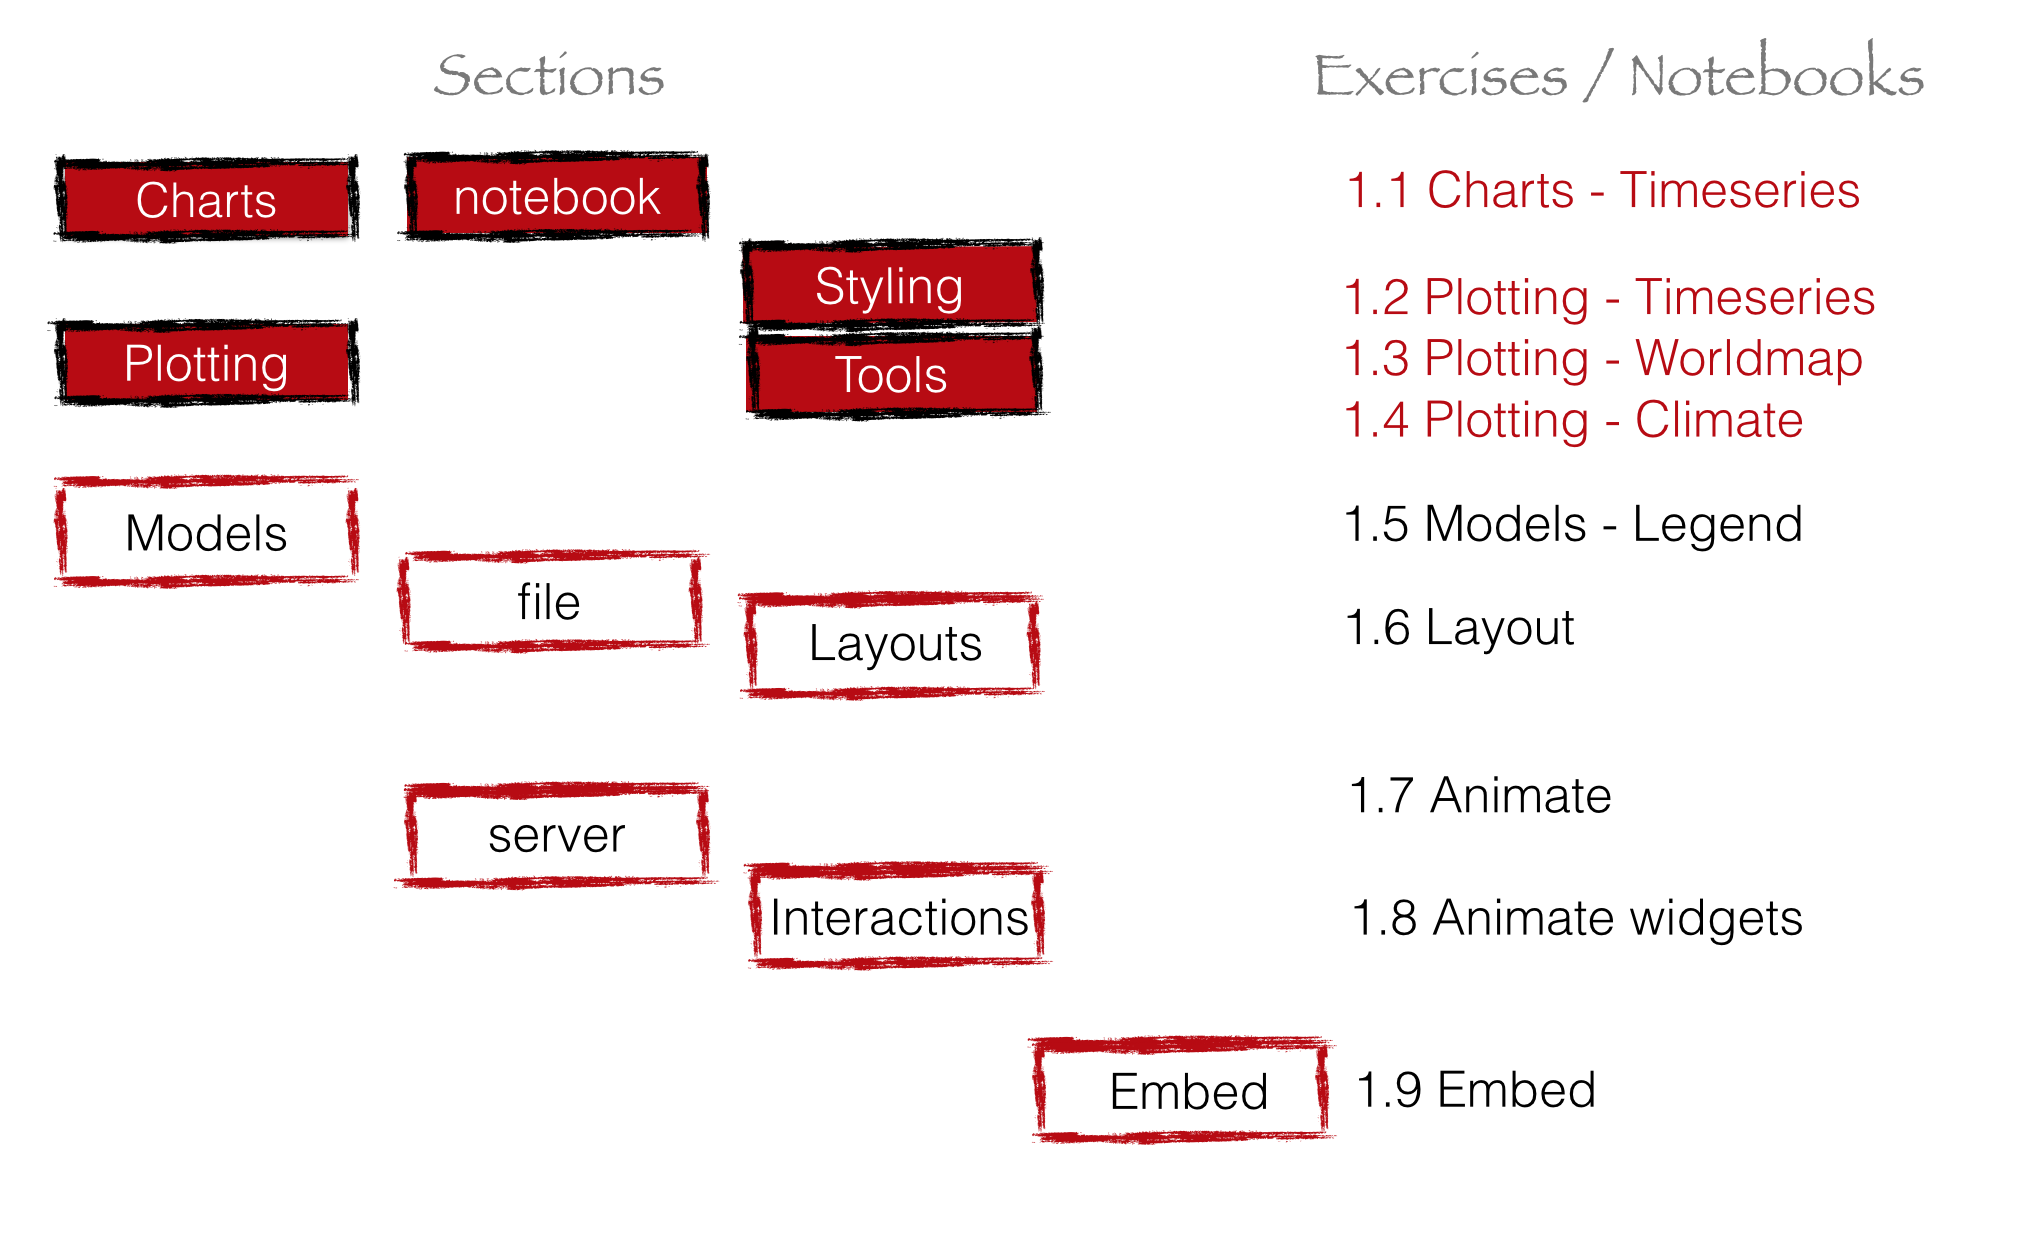
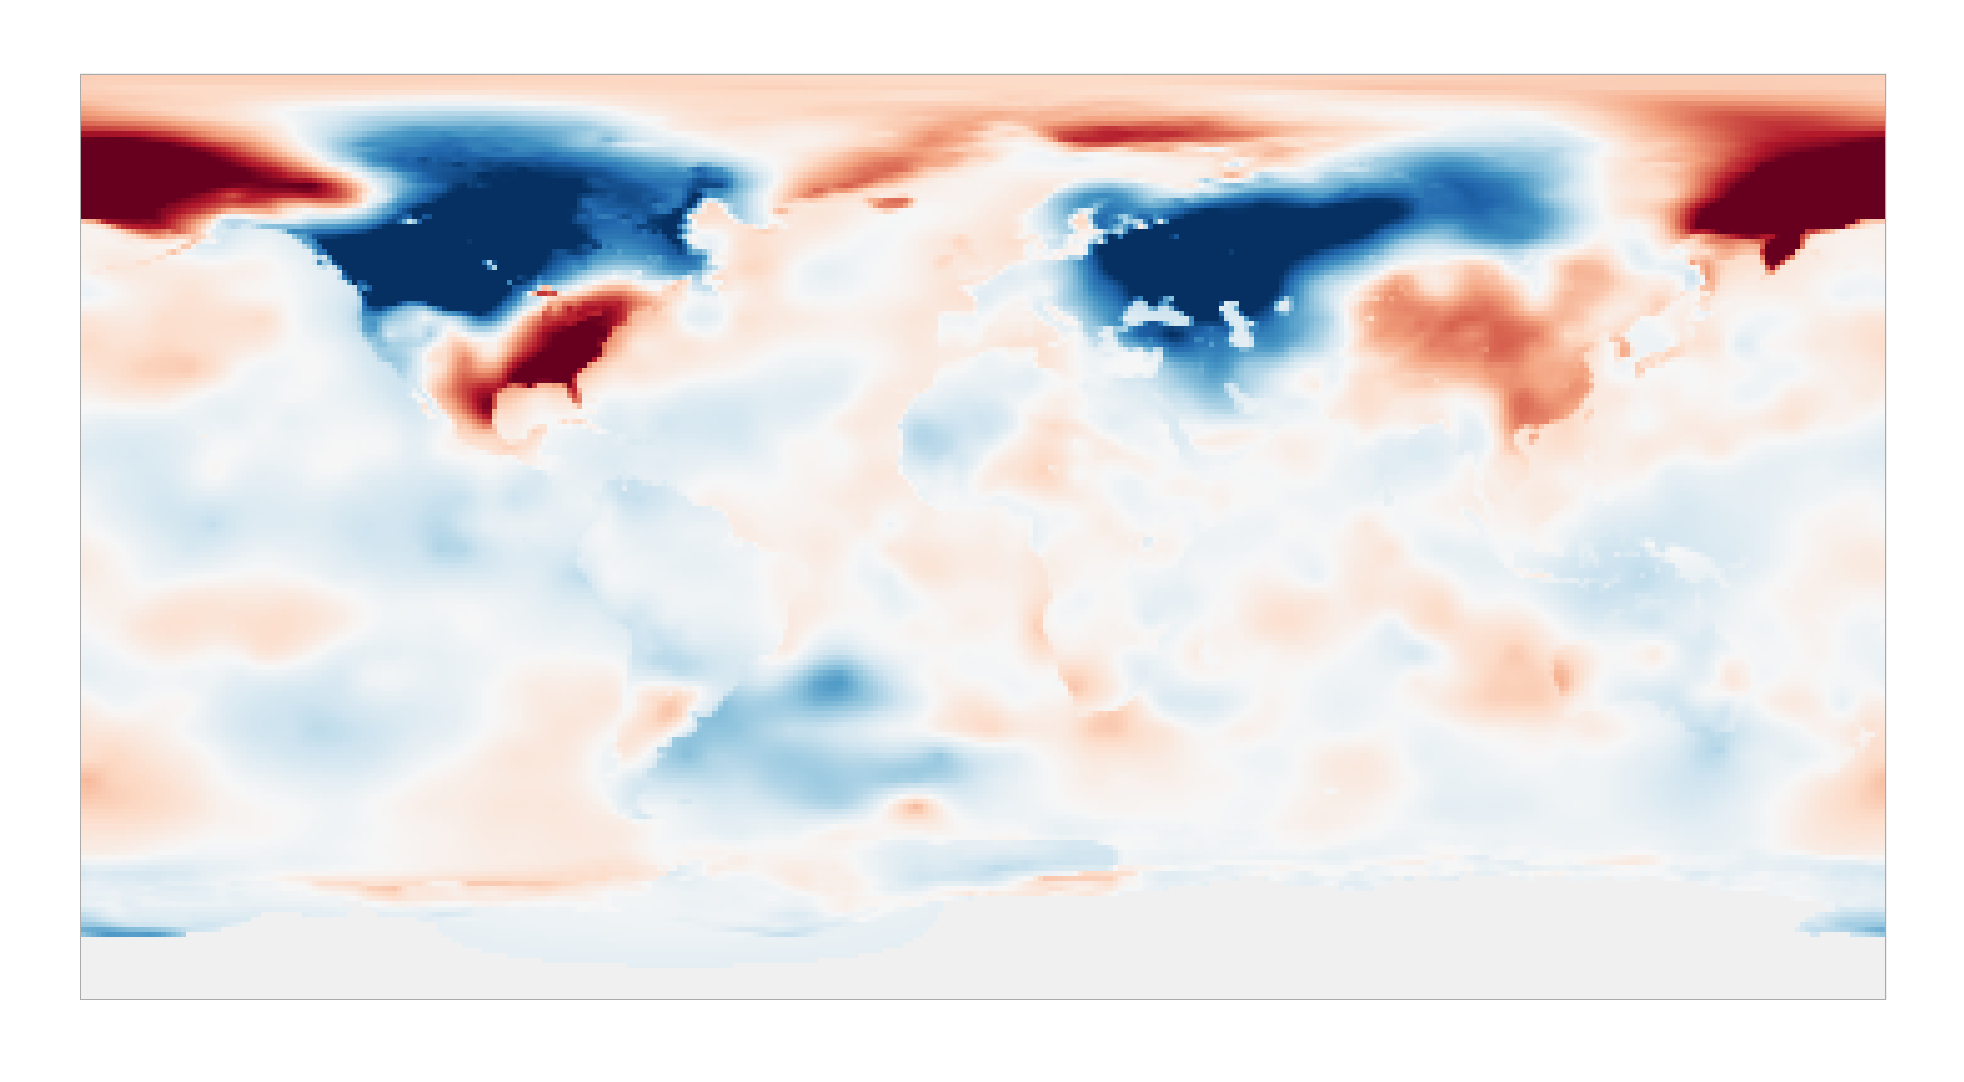
Exercises
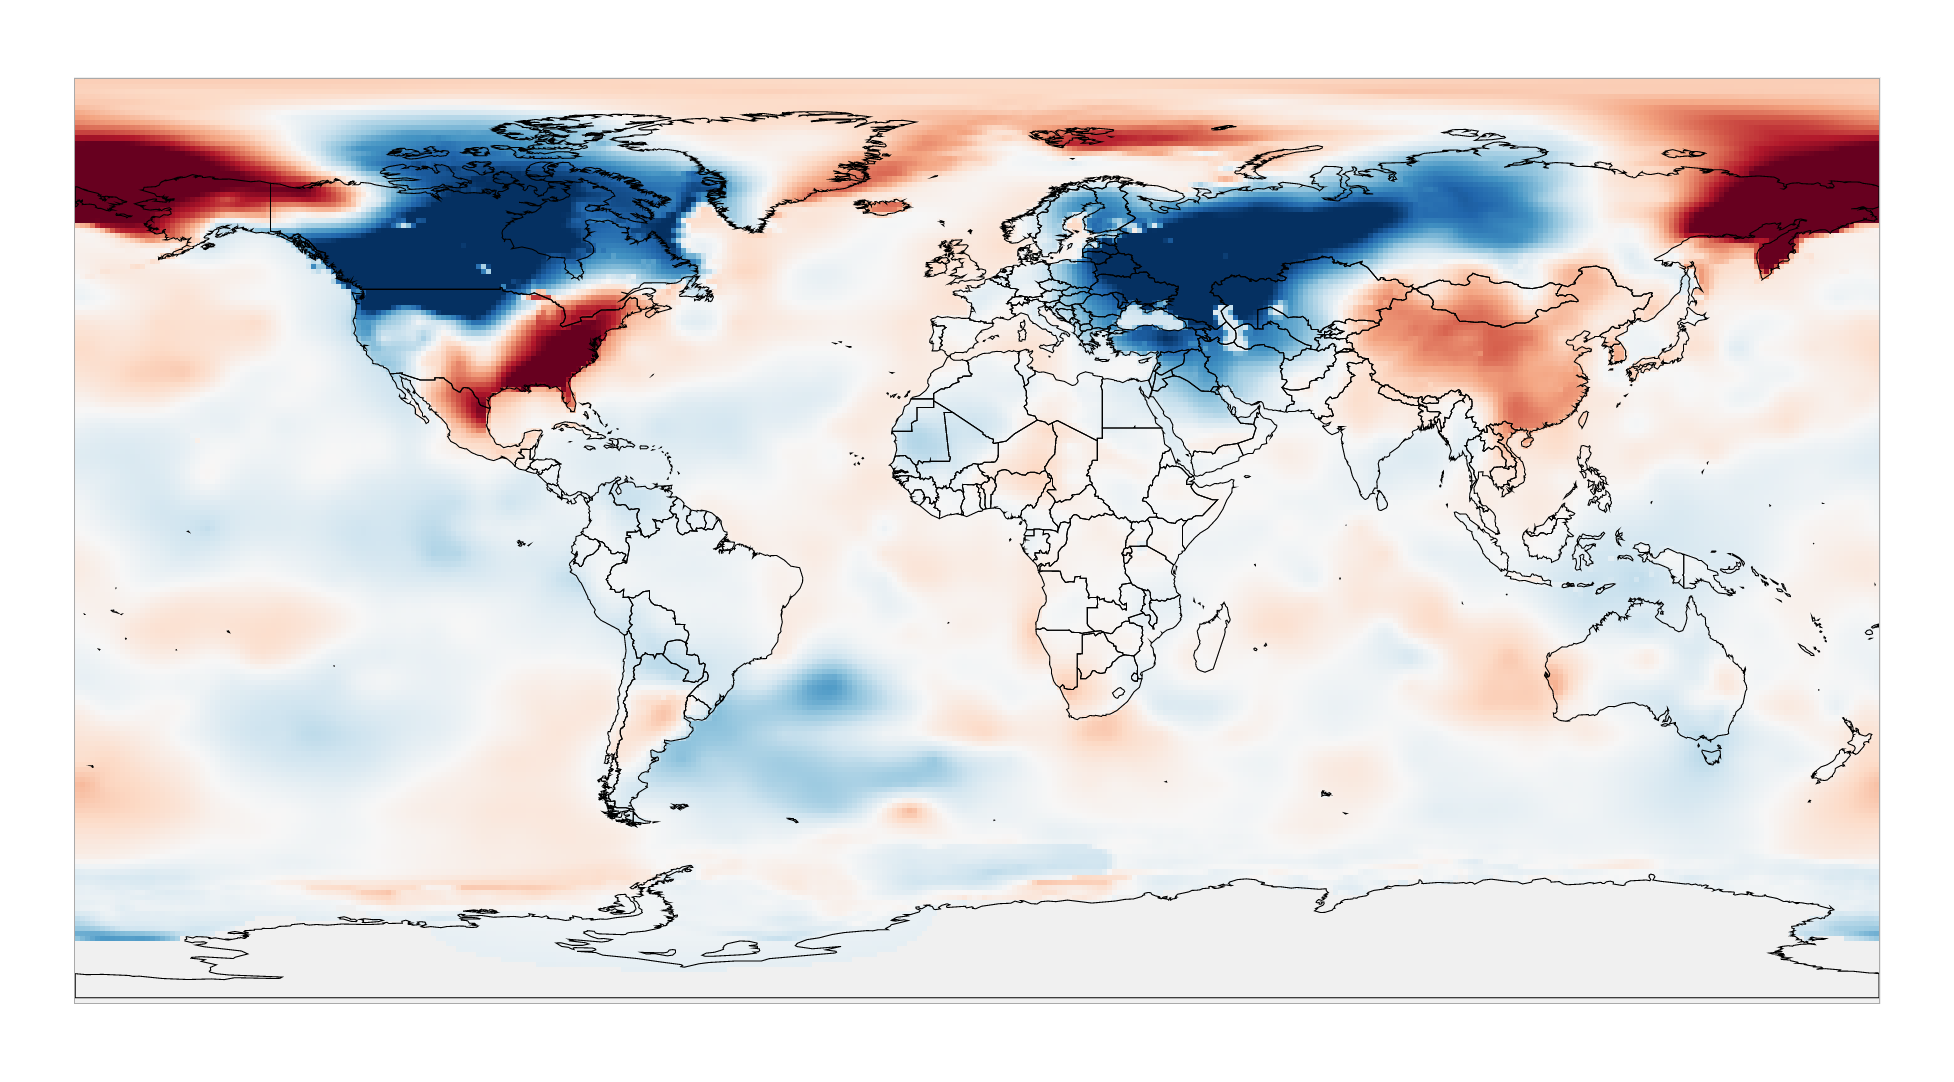
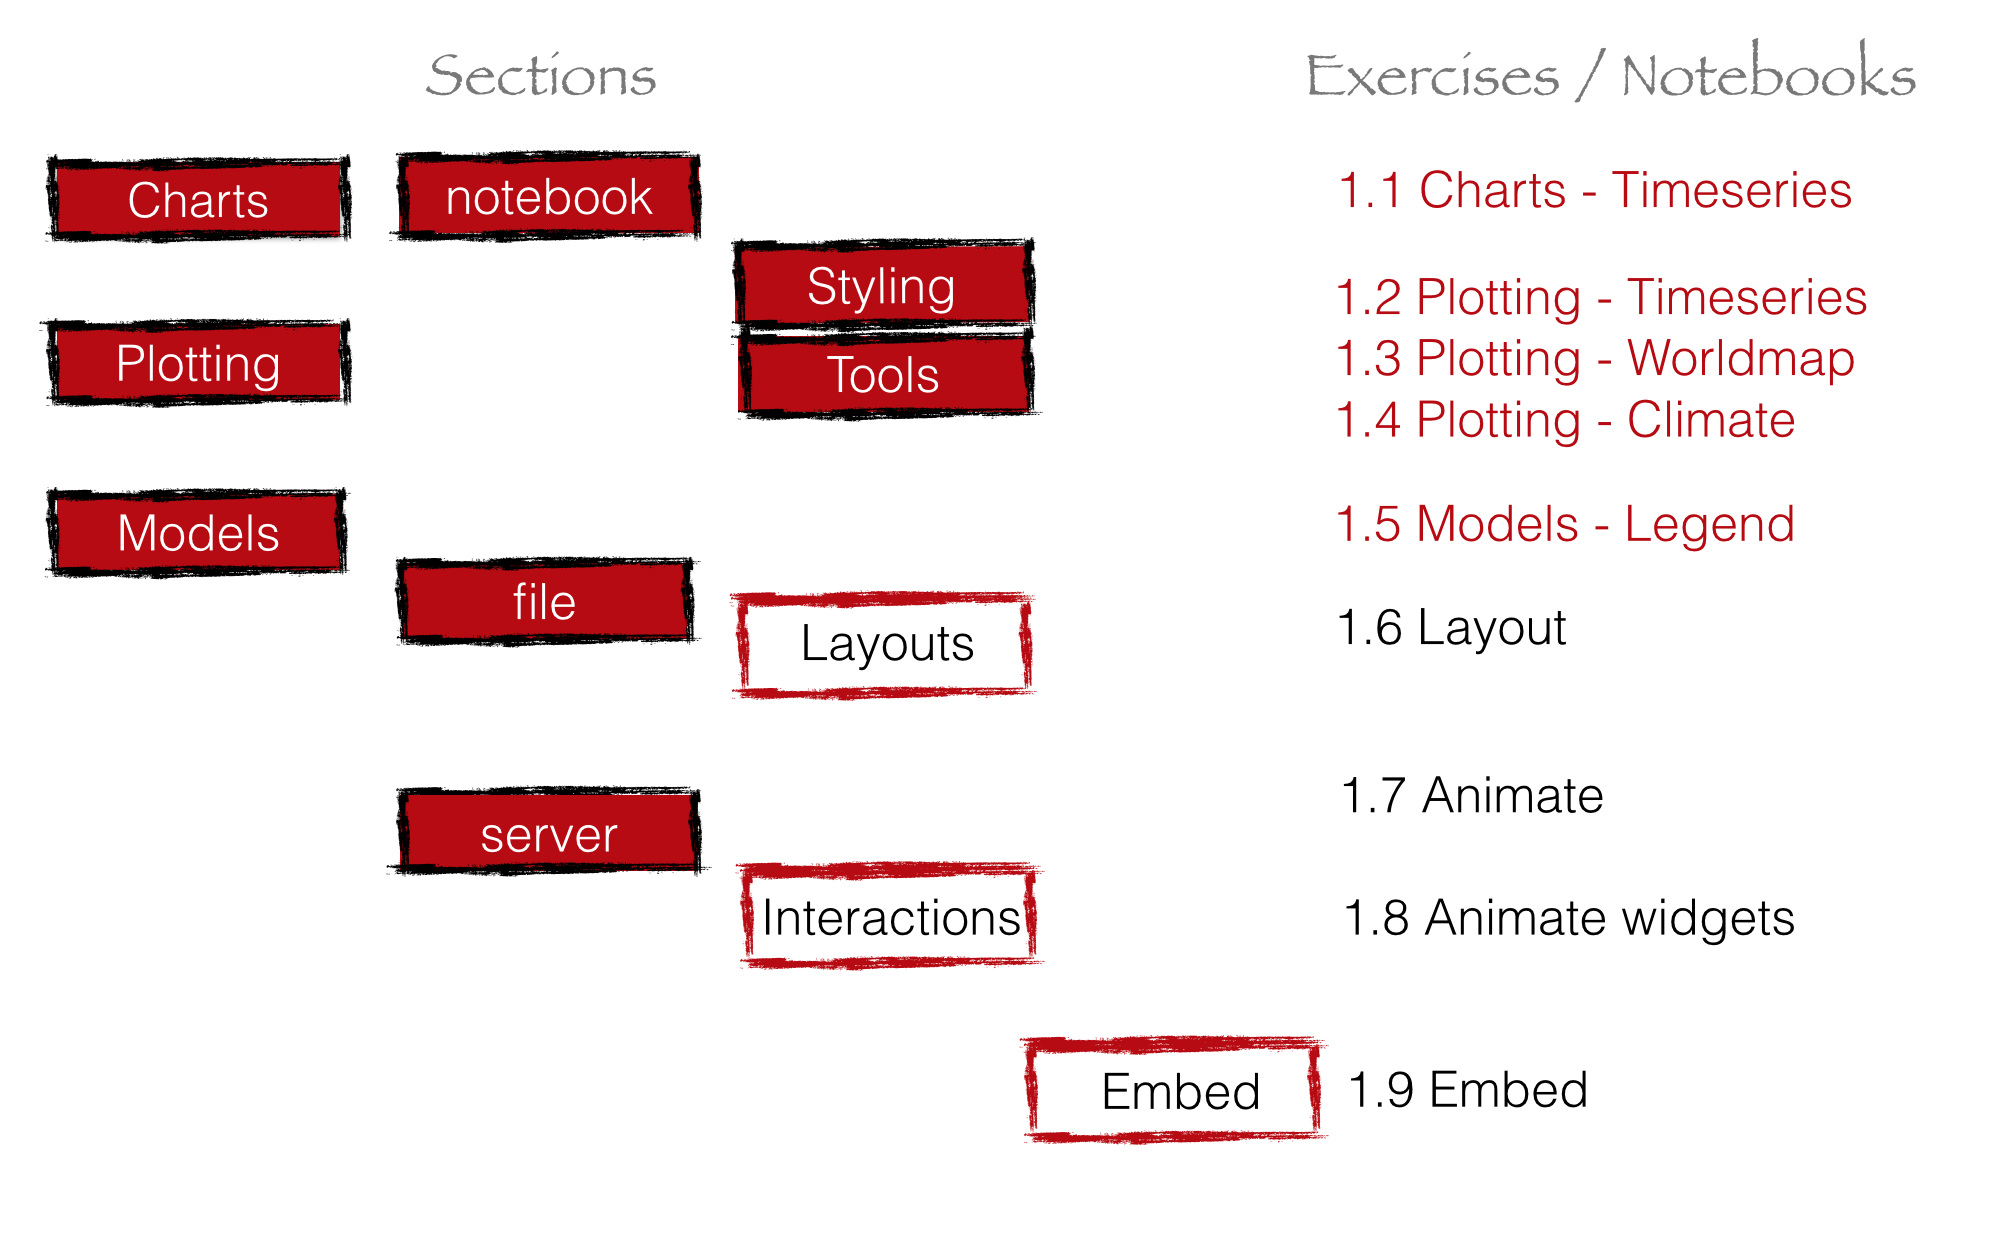
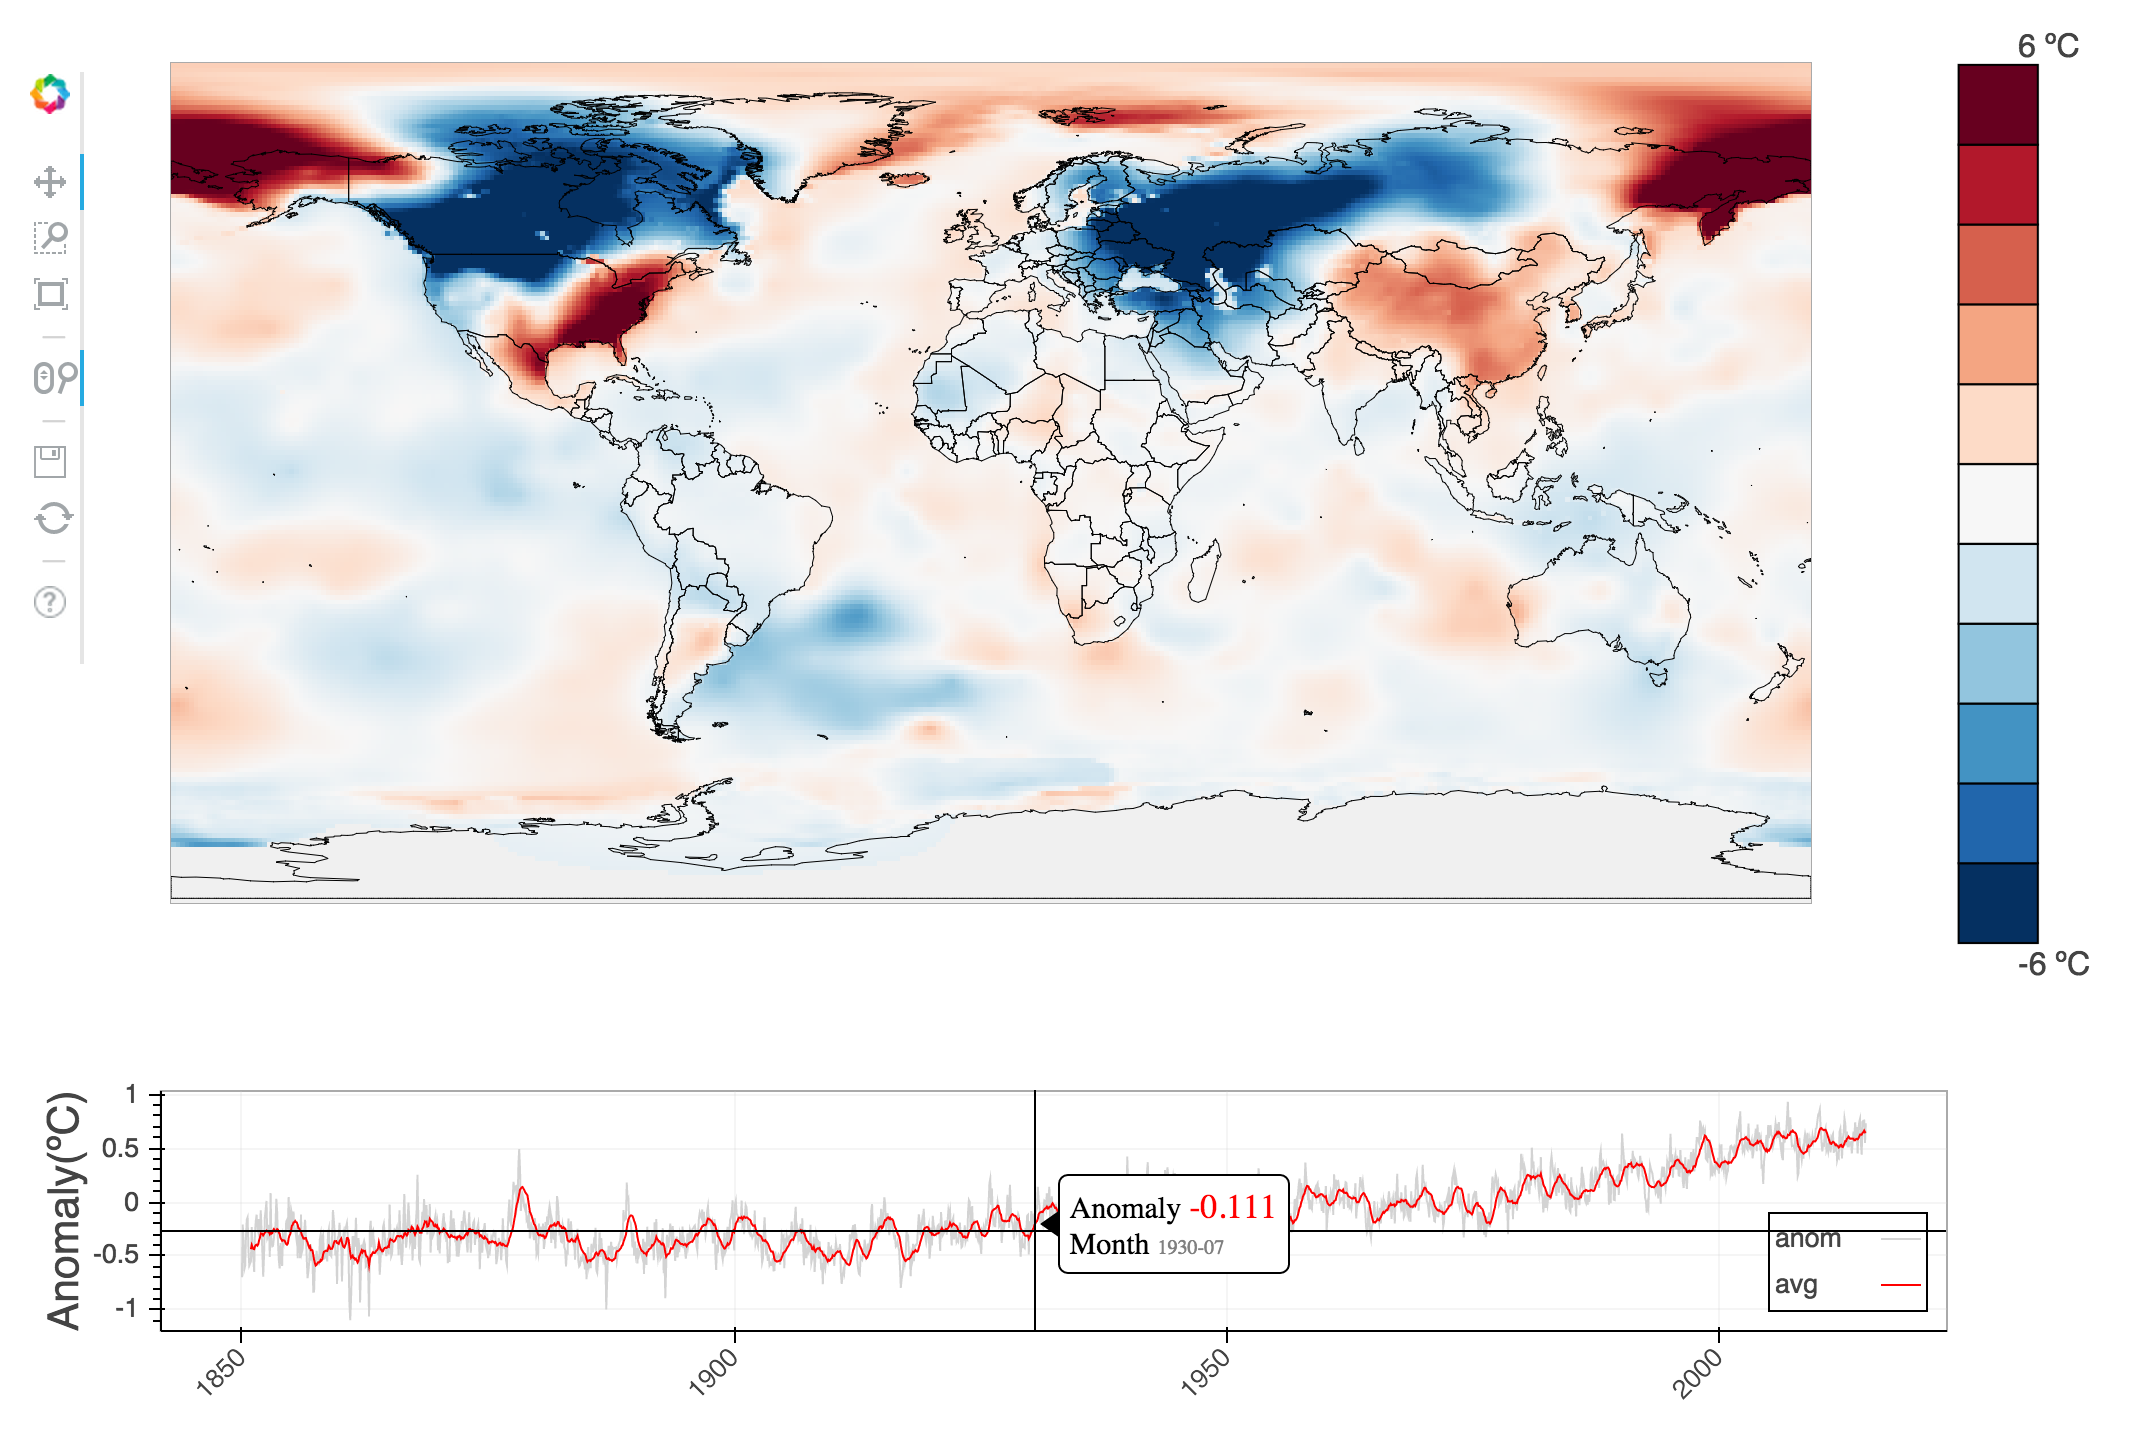
1.4 Plotting - Climate.ipynb
Plot temperature anomaly monthly average for a given year and month by lat/lon with bokeh.plotting.image_rgba()
15 min
Exercises
1.4 Plotting - Climate.ipynb
Exercises
1.4 Plotting - Climate.ipynb
Overlay the worldmap boundaries in the temperature image plot
5 min
Exercises
1.4 Plotting - Climate.ipynb
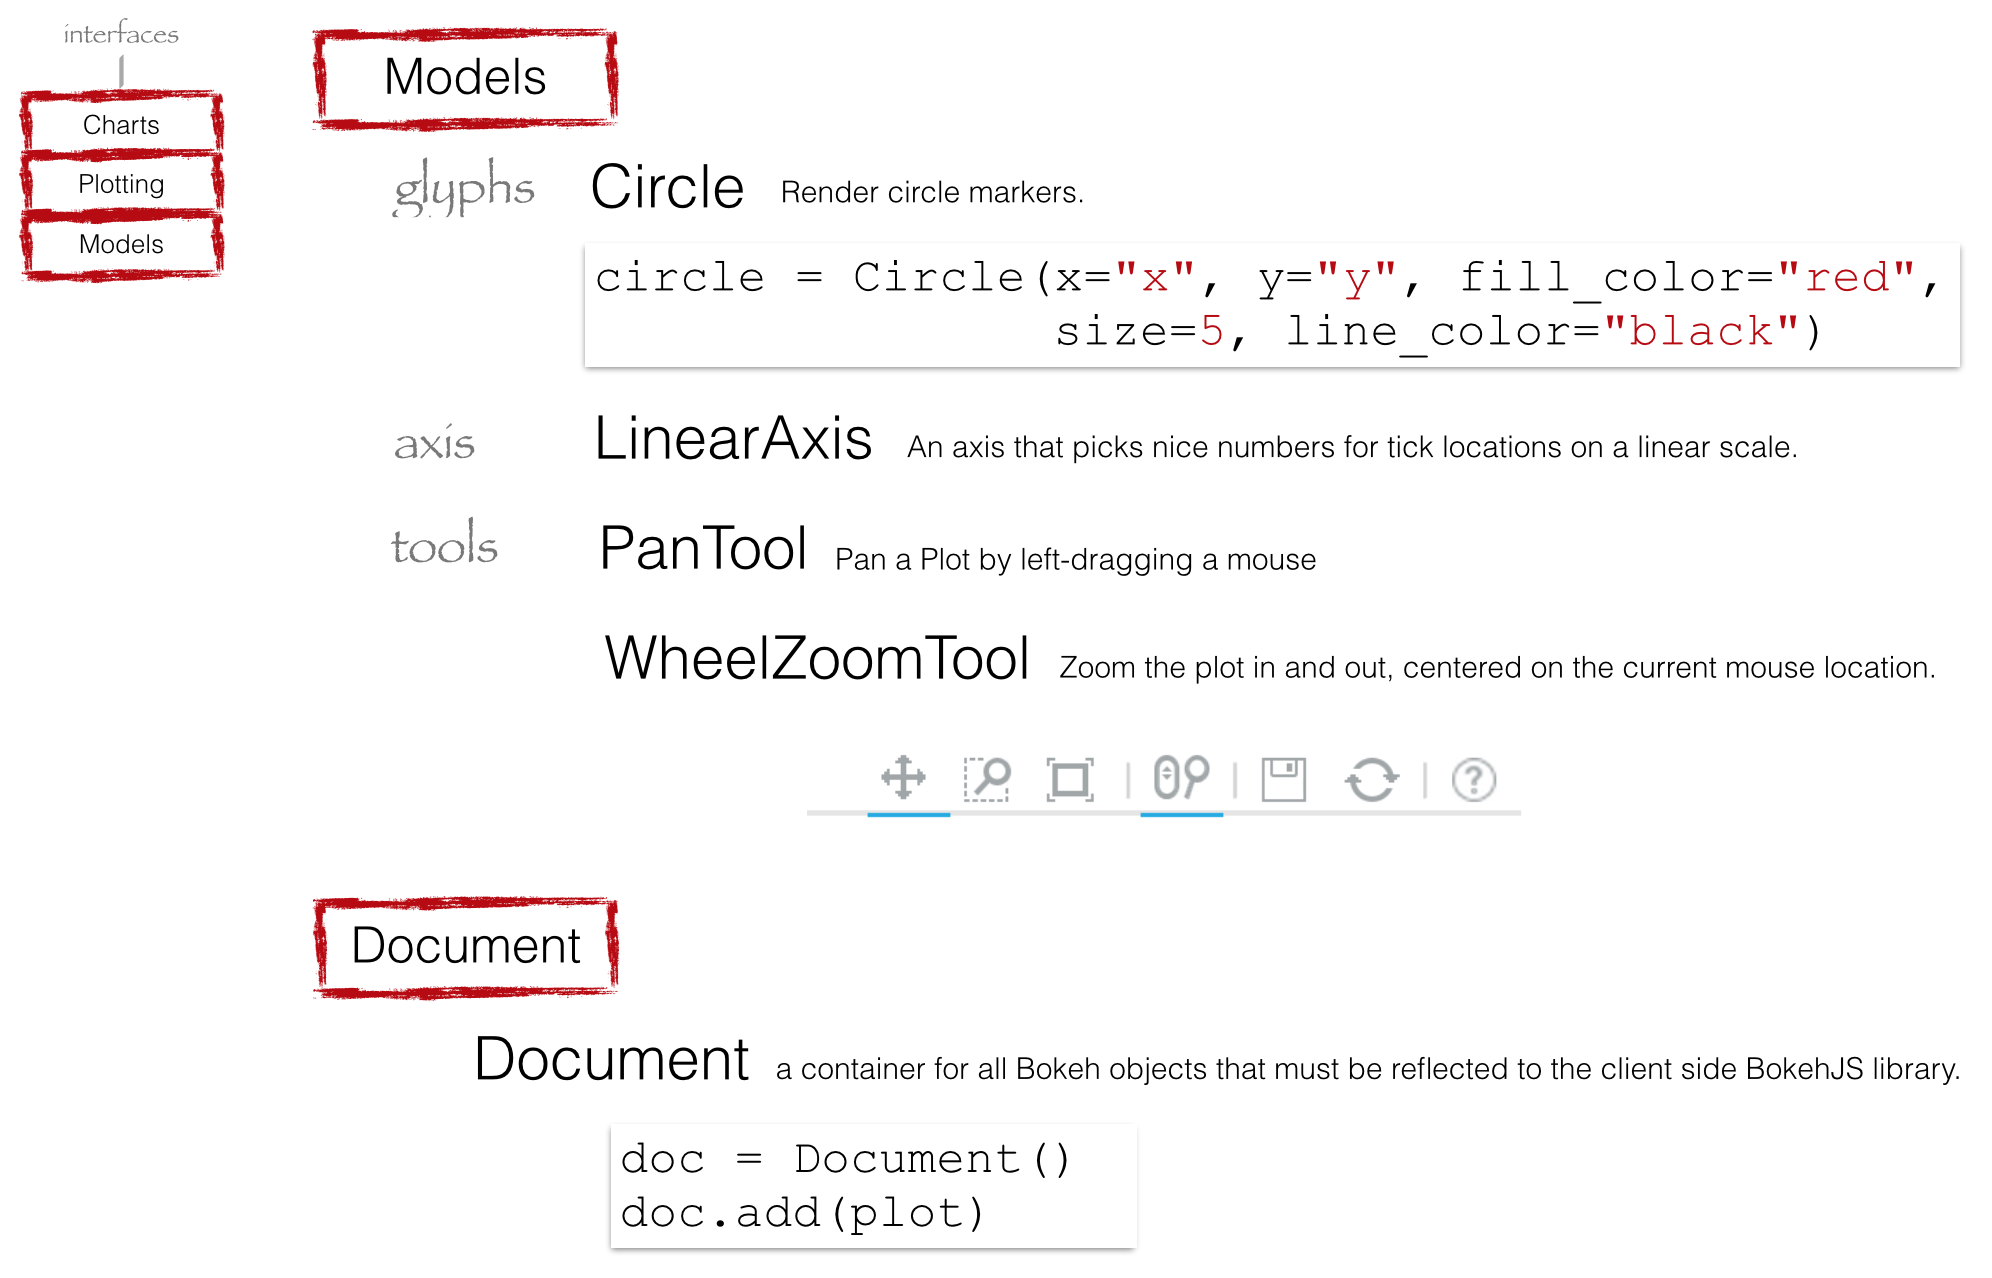
Models
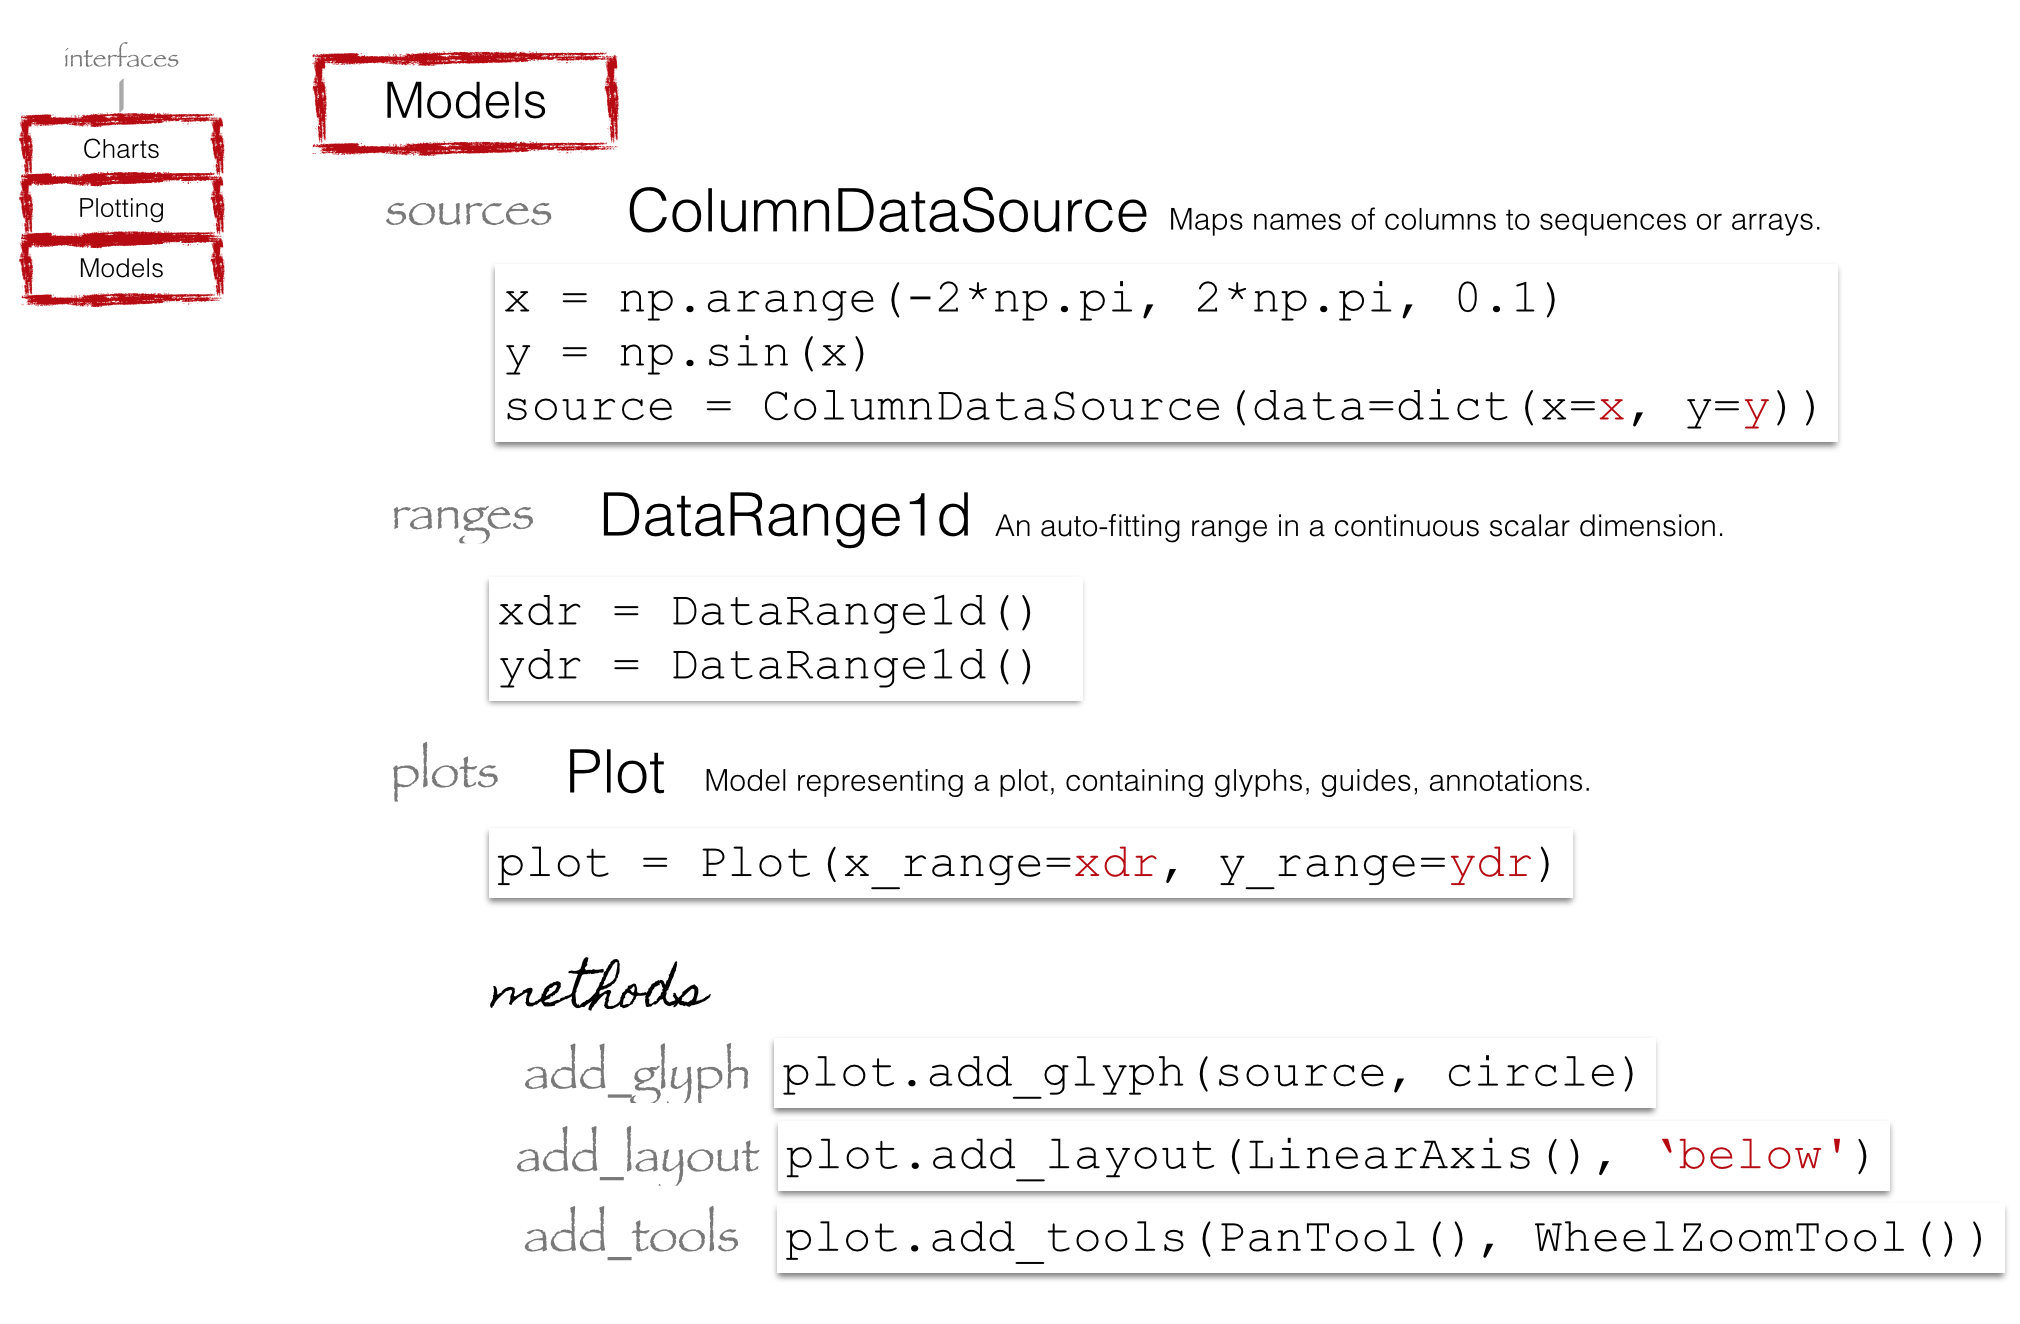
Resources
http://bokeh.pydata.org/en/latest/docs/reference/models.html
Exercises
1.5 Glyphs - Legend.ipynb
Create a legend plot for the temperature map with the Glyph interface
10 min
Exercises
1.5 Glyphs - Legend.ipynb
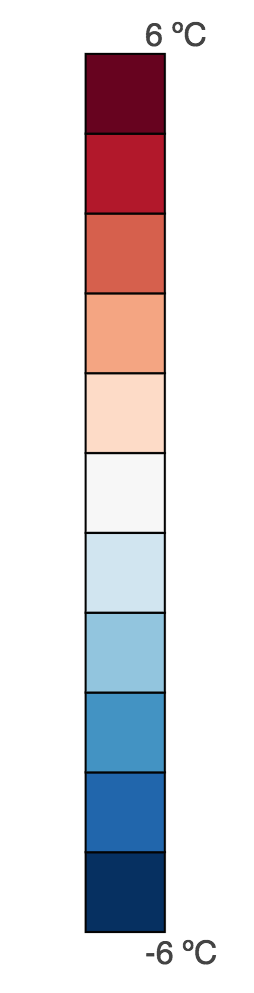
Output
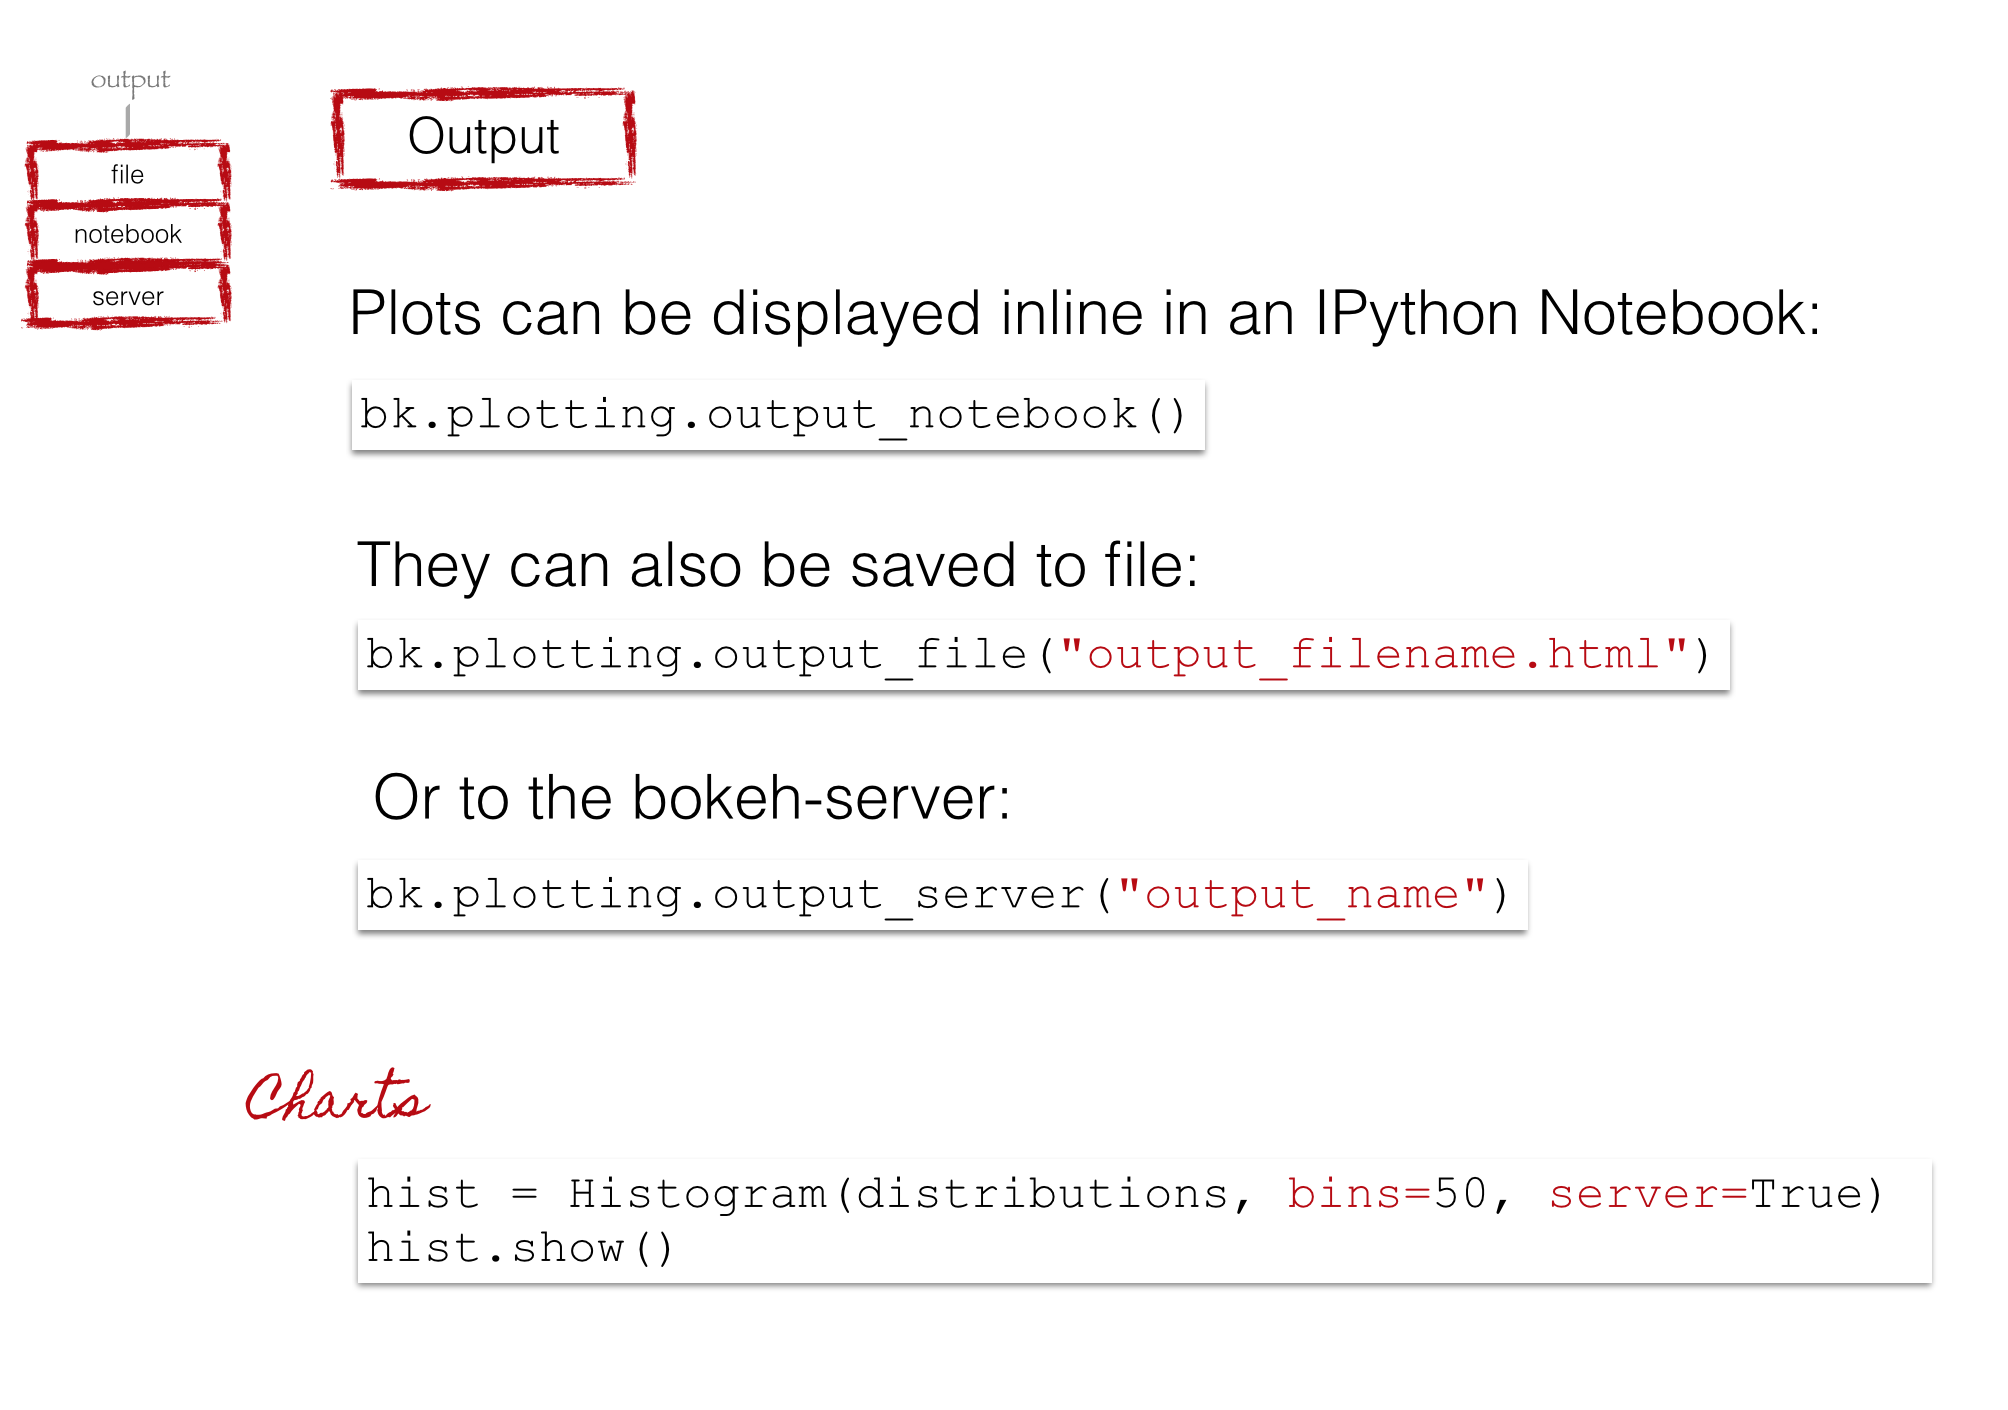
Resources
http://bokeh.pydata.org/en/latest/docs/reference/resources_embedding.html#bokeh-io
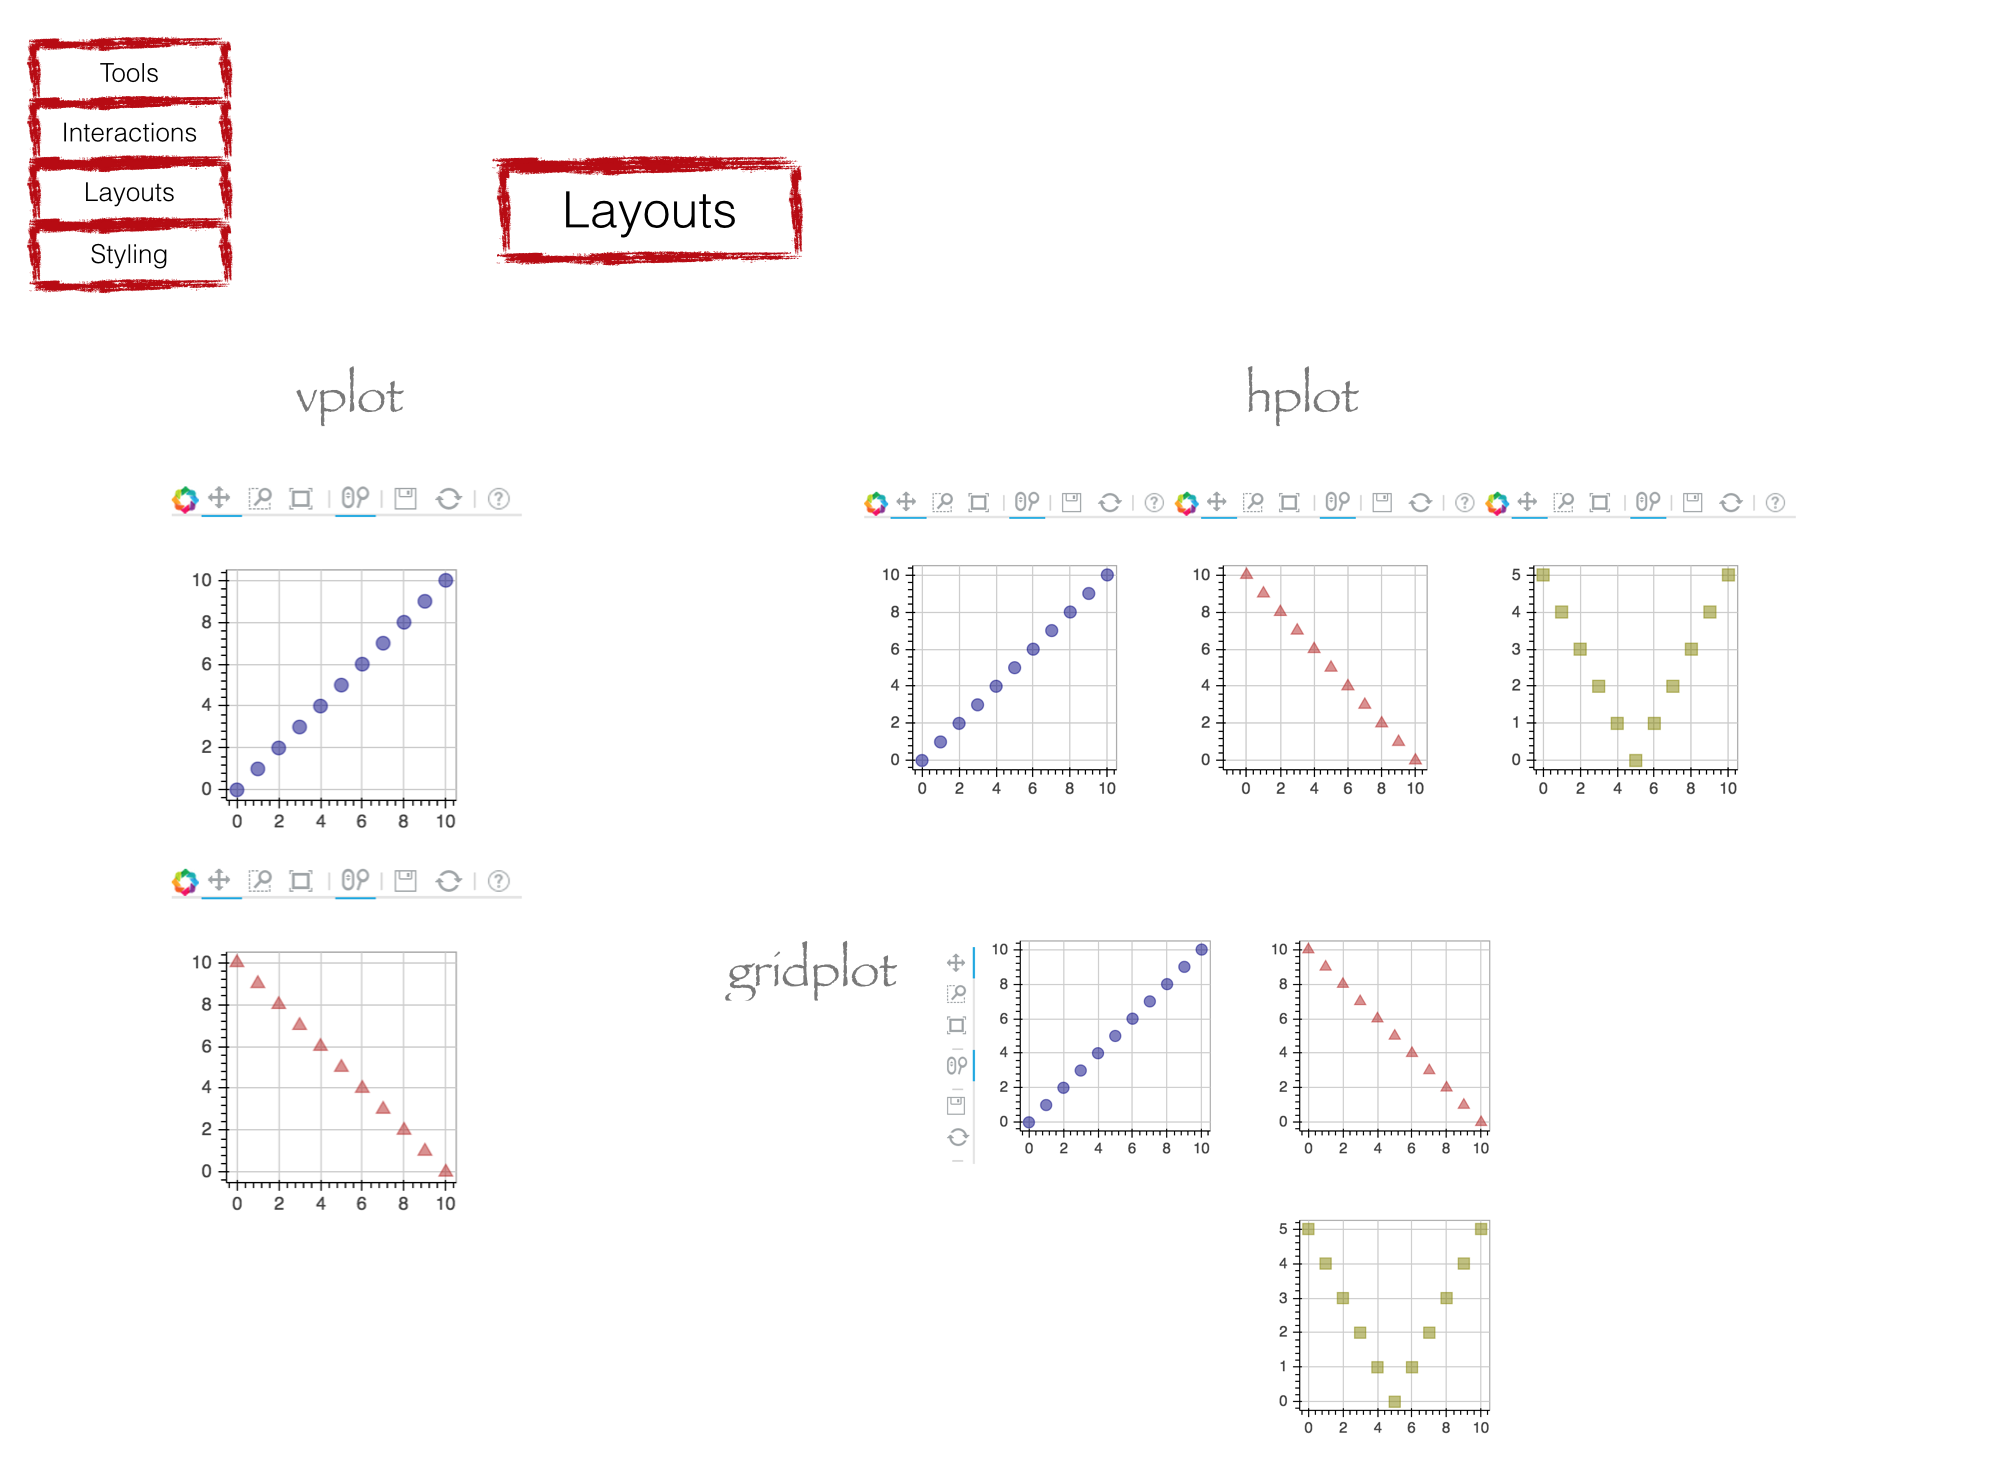
Layout
Resources
http://bokeh.pydata.org/en/latest/docs/user_guide/layout.html
Exercises
1.6 Layout.ipynb
Wrap your visualizations in functions
Wrap each of the previous visualizations in a function in a python file (e.g. viz.py):
10 min
Exercises
1.6 Layout.ipynb
Layout your plots using hplot and vplot
5 min
Exercises
1.6 Layout.ipynb
Exercises
1.6 Layout.ipynb
Store your layout in an html page
2 min
Server
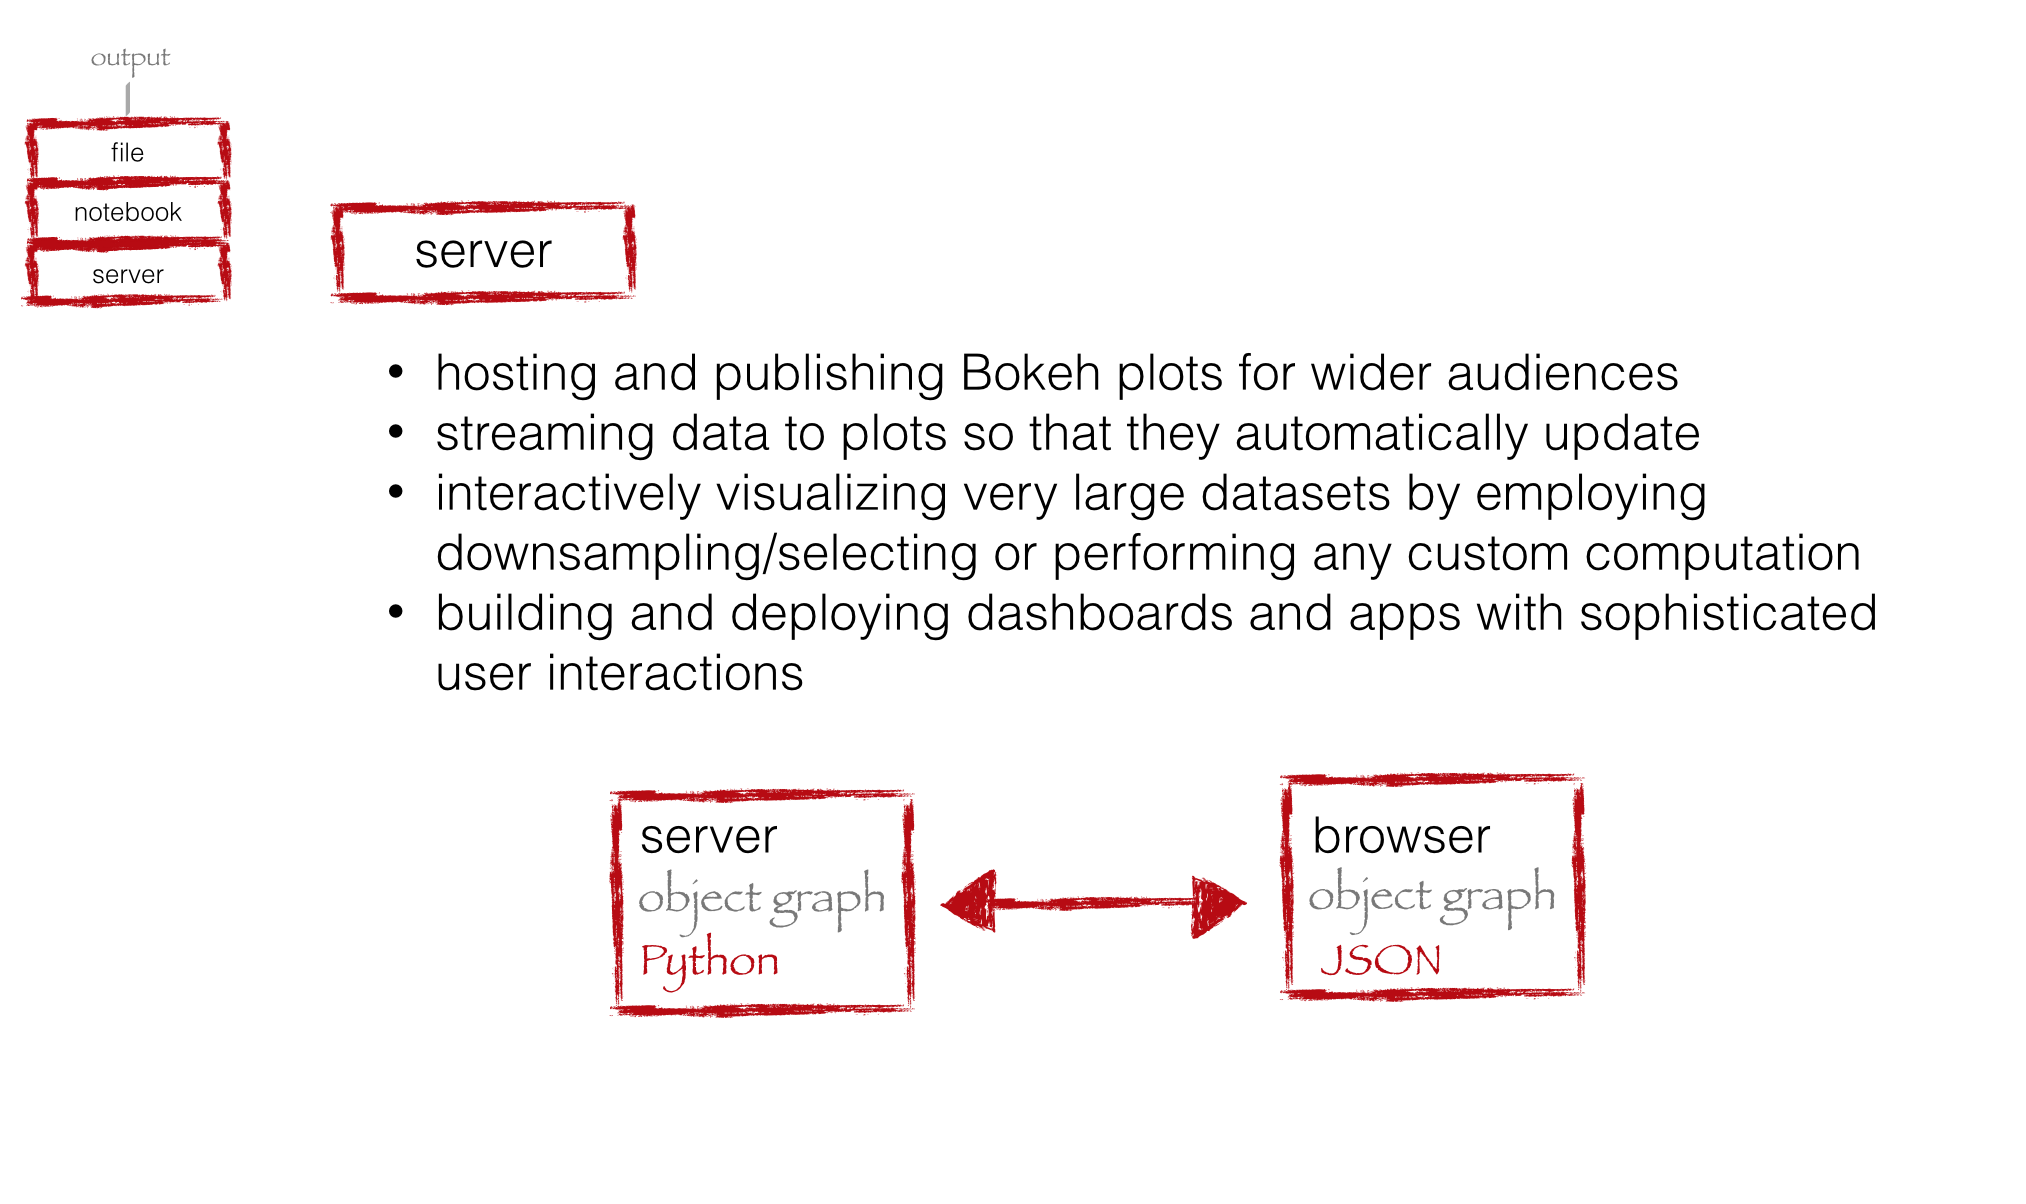
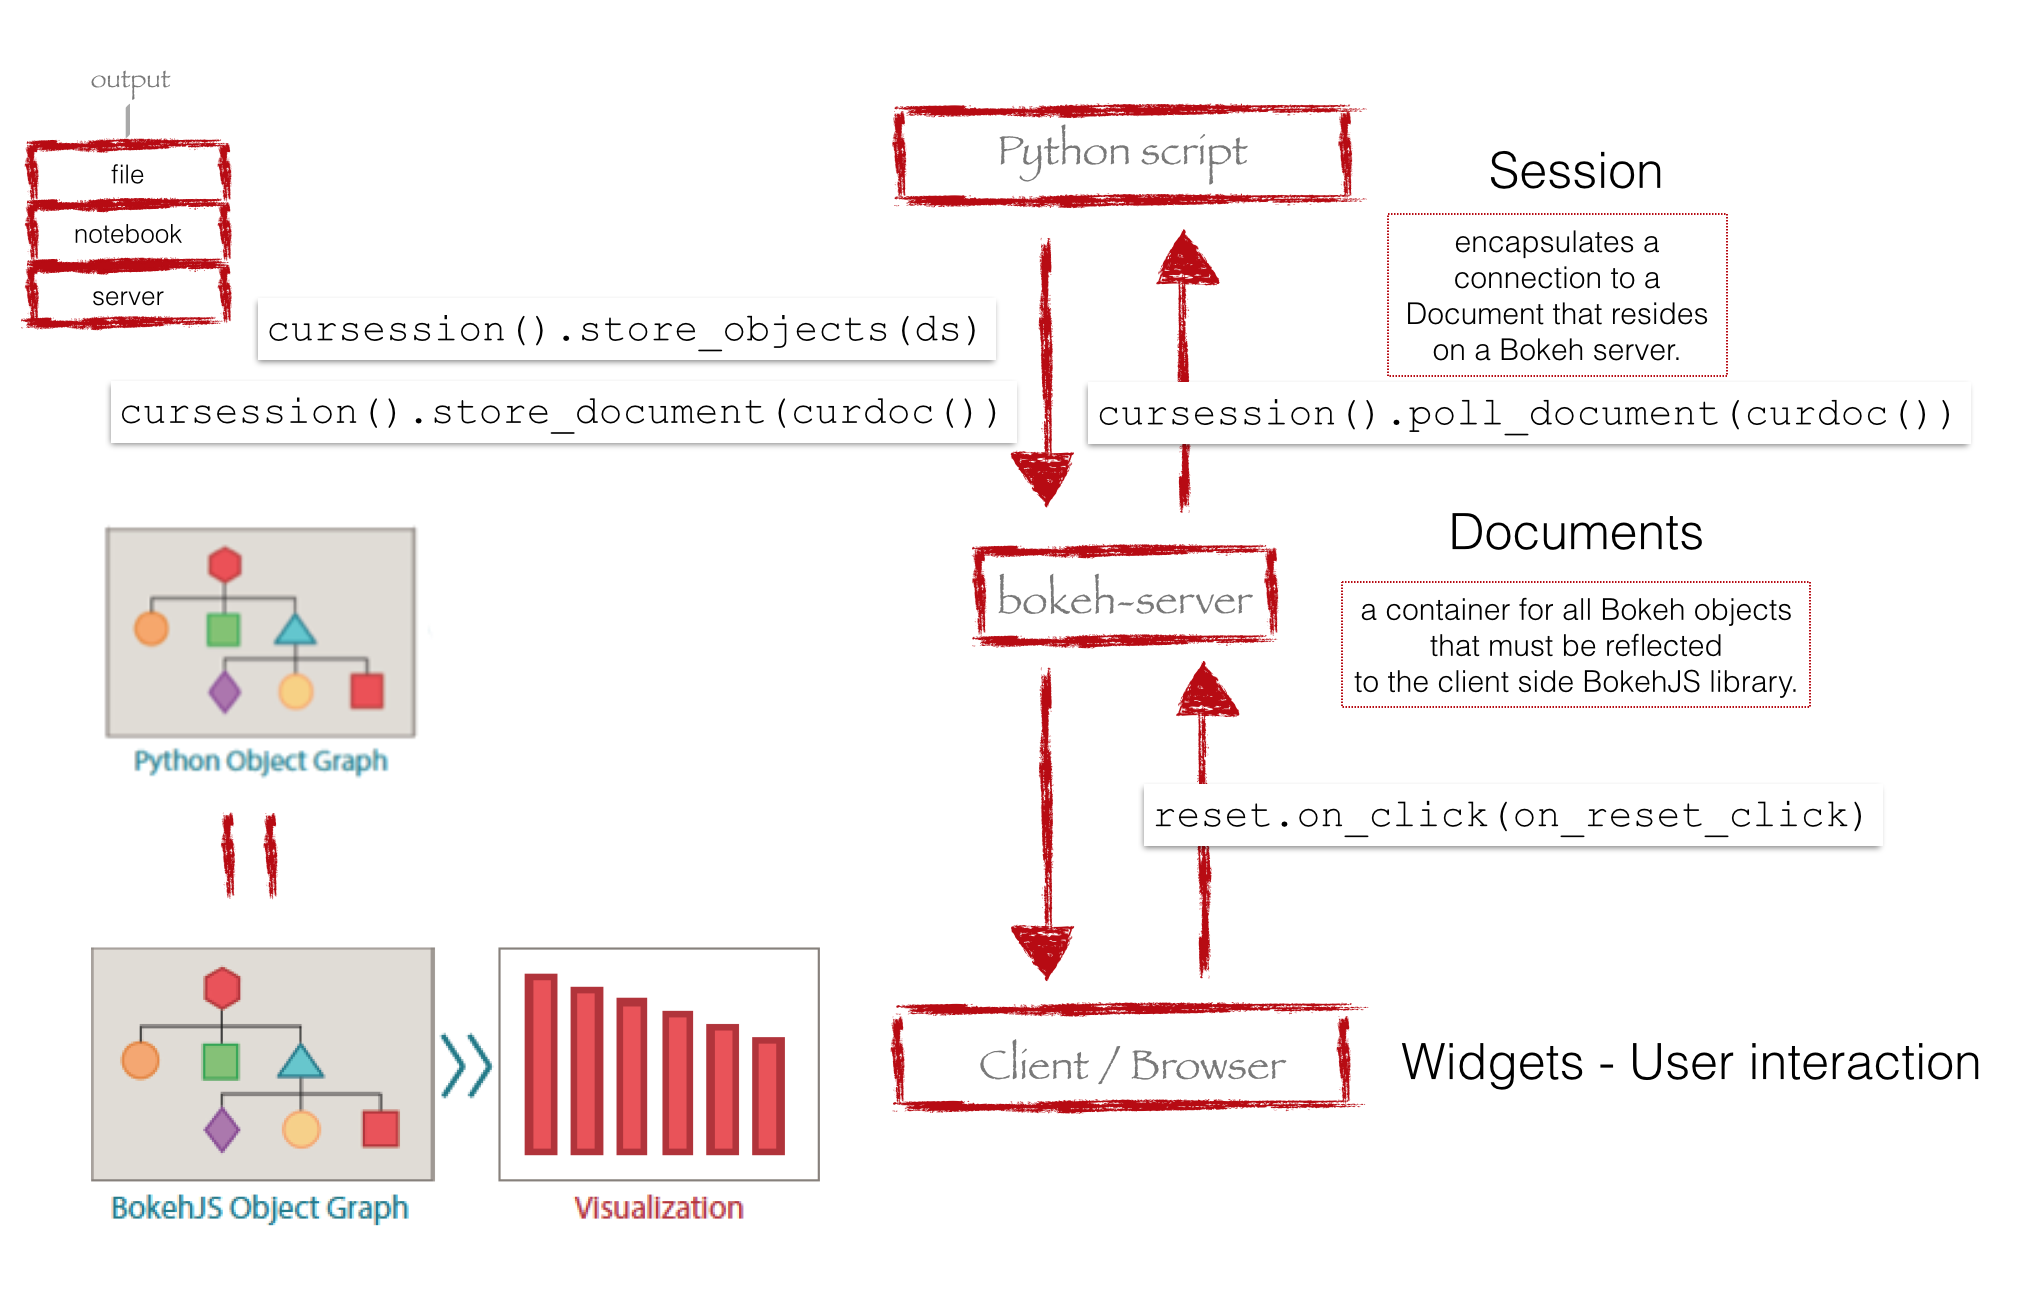
Resources
http://bokeh.pydata.org/en/latest/docs/reference/plot_objects.html
http://bokeh.pydata.org/en/latest/docs/user_guide/server.html
Examples:
Exercises
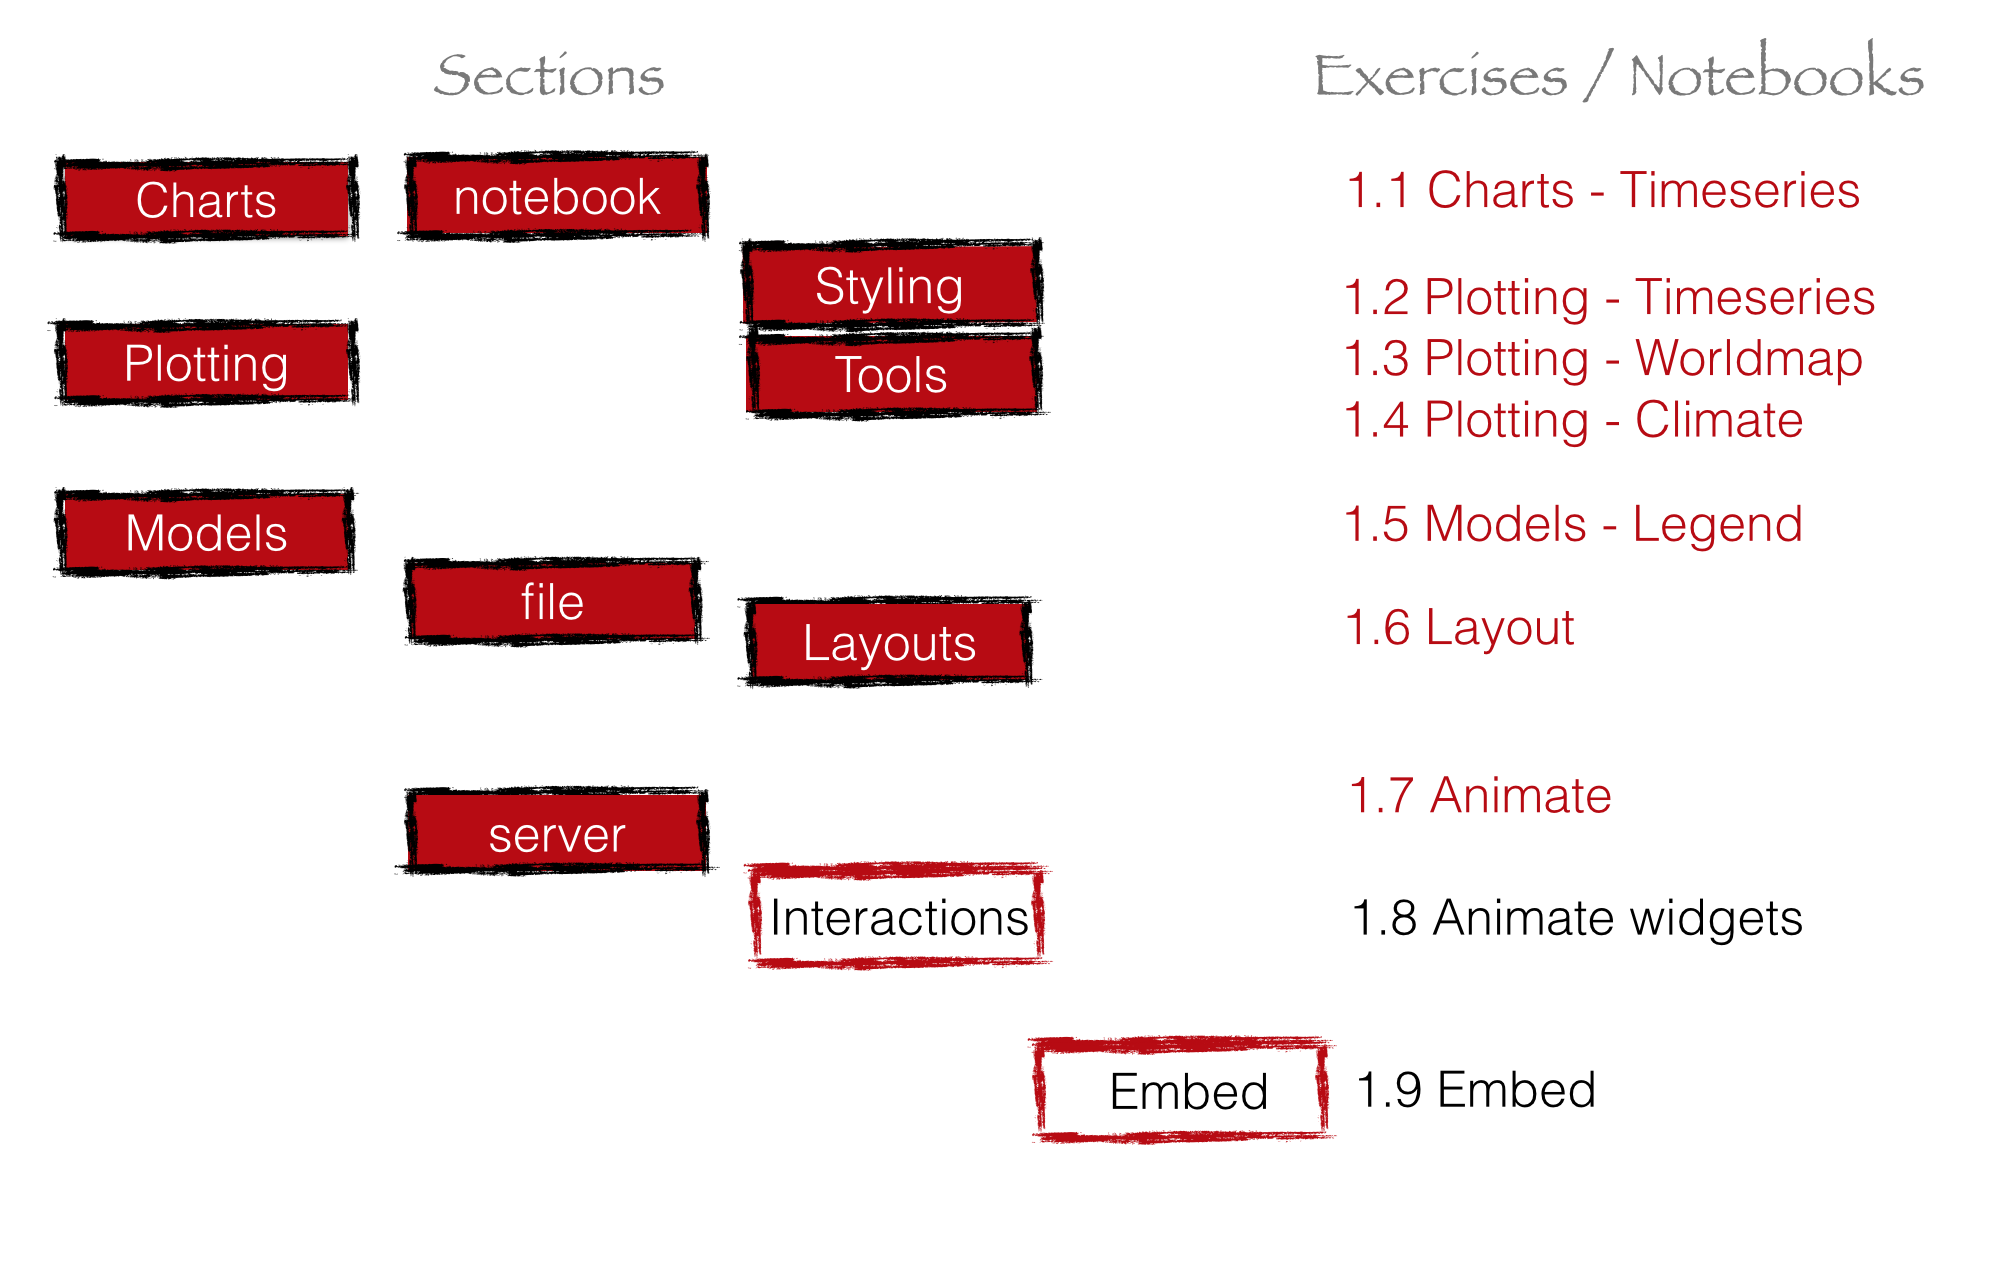
1.7 Animate.ipynb
Animate the climate map
20 min
Exercises
1.7 Animate.ipynb
Exercises
1.7 Animate - optional.ipynb
[OPTIONAL] Add a title plot for the app with month and year that gets updated with the plot animation
10 min
Exercises
1.7 Animate - optional.ipynb
Exercises
1.7 Animate - optional 2.ipynb
[OPTIONAL] Animate the timeseries plot
10 min
Exercises
1.7 Animate - optional 2.ipynb
Interactions

Resources
http://bokeh.pydata.org/en/latest/docs/user_guide/interaction.html
Examples:
Exercises
1.8 Animate Widgets
[OPTION A] Add a play and stop button
[OPTION B] Add sliders to select the year and month
15 min
Exercises
1.8 Animate Widgets
Embed
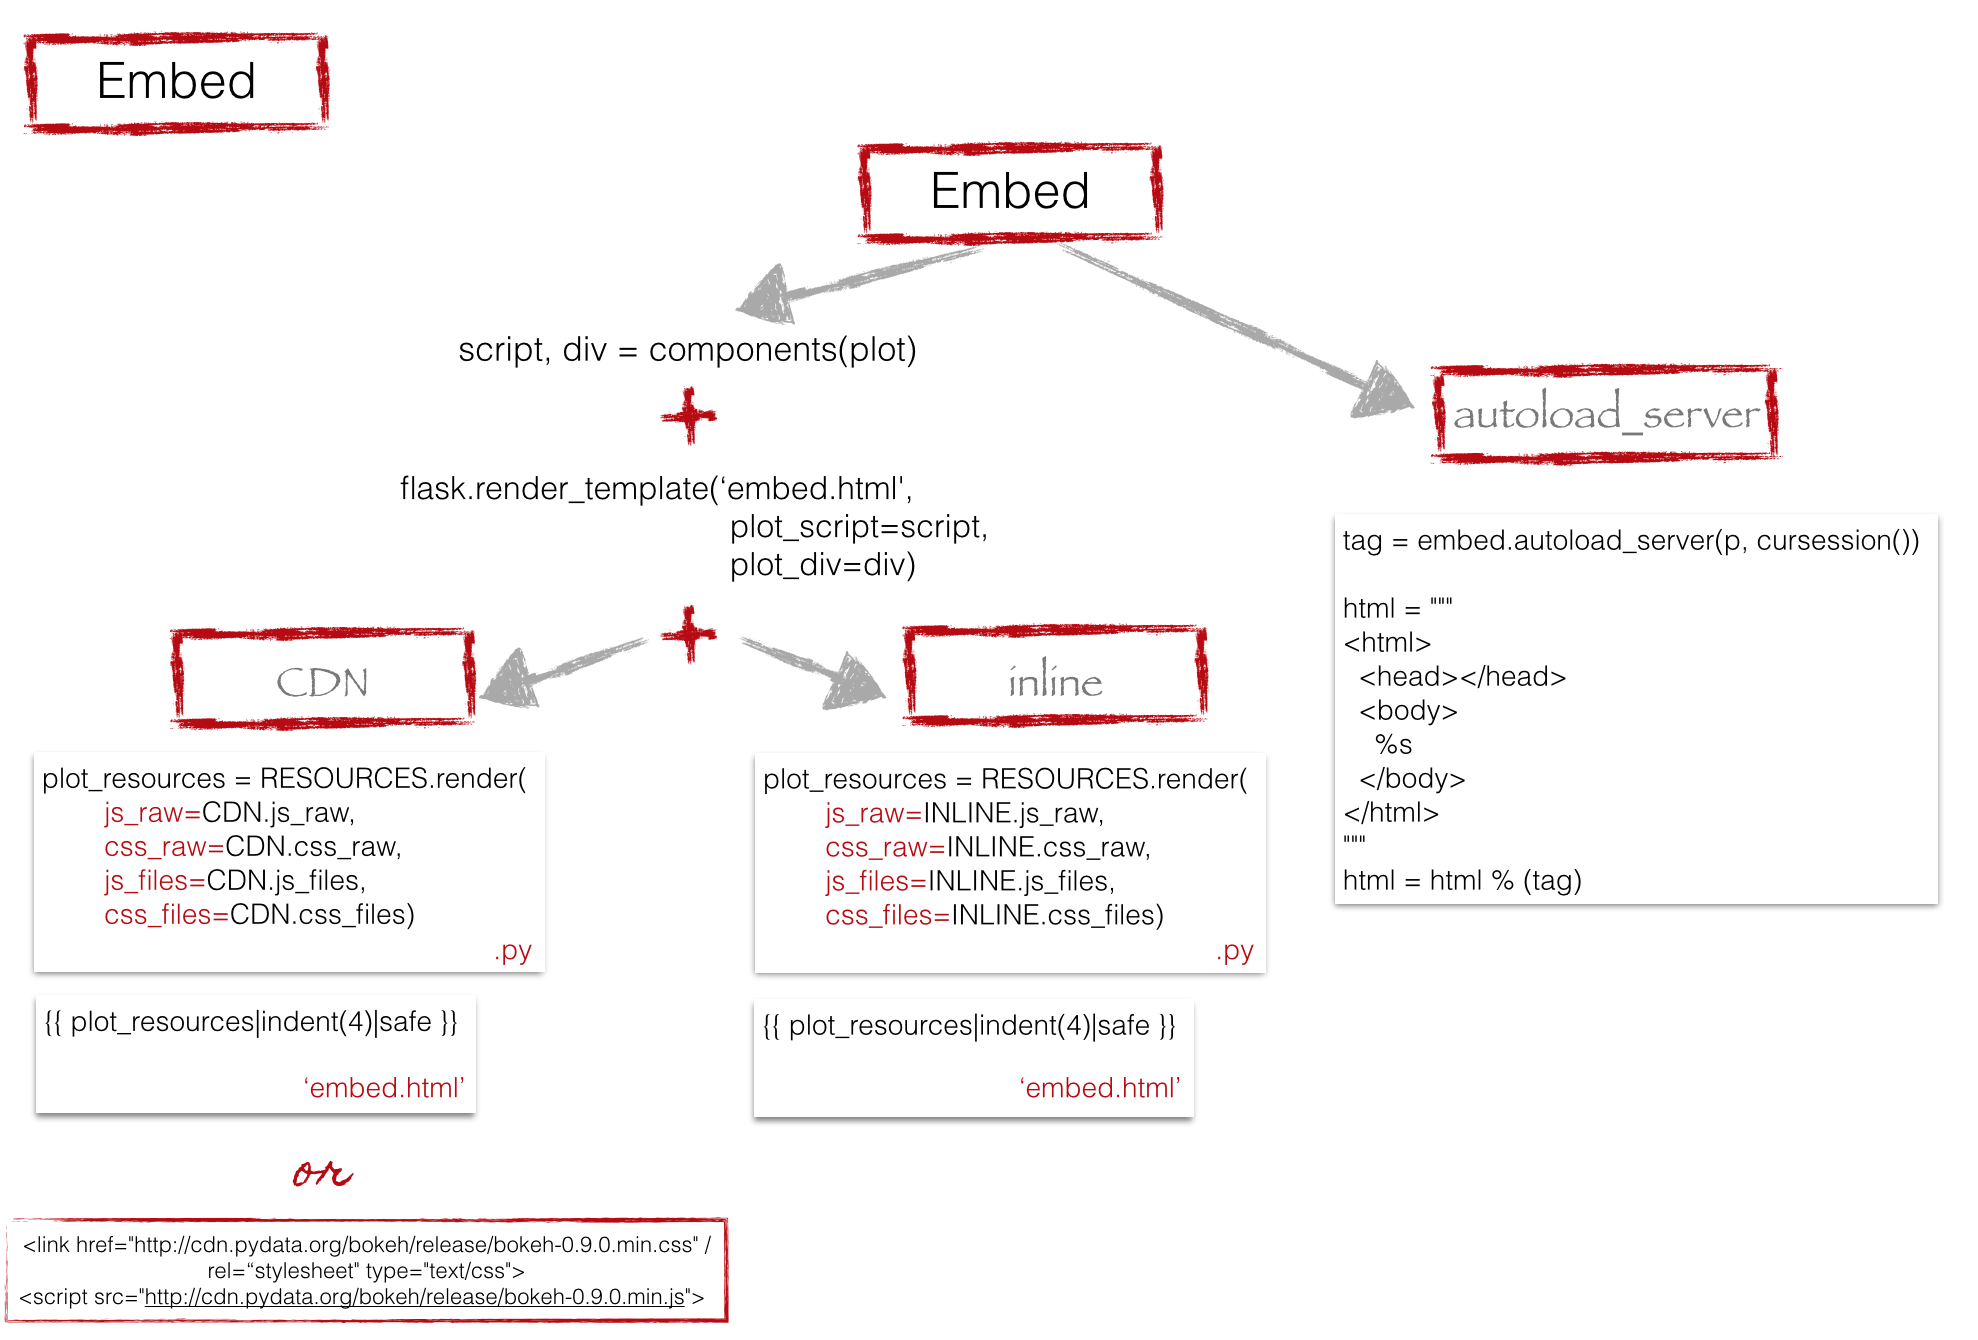
Resources
Exercise
1.9 Embed
[Exercise 1] Embed the original static layout into a flask app
[Exercise 2] Embed your interactive app into a flask application
15 min
Exercises
1.9 Embed
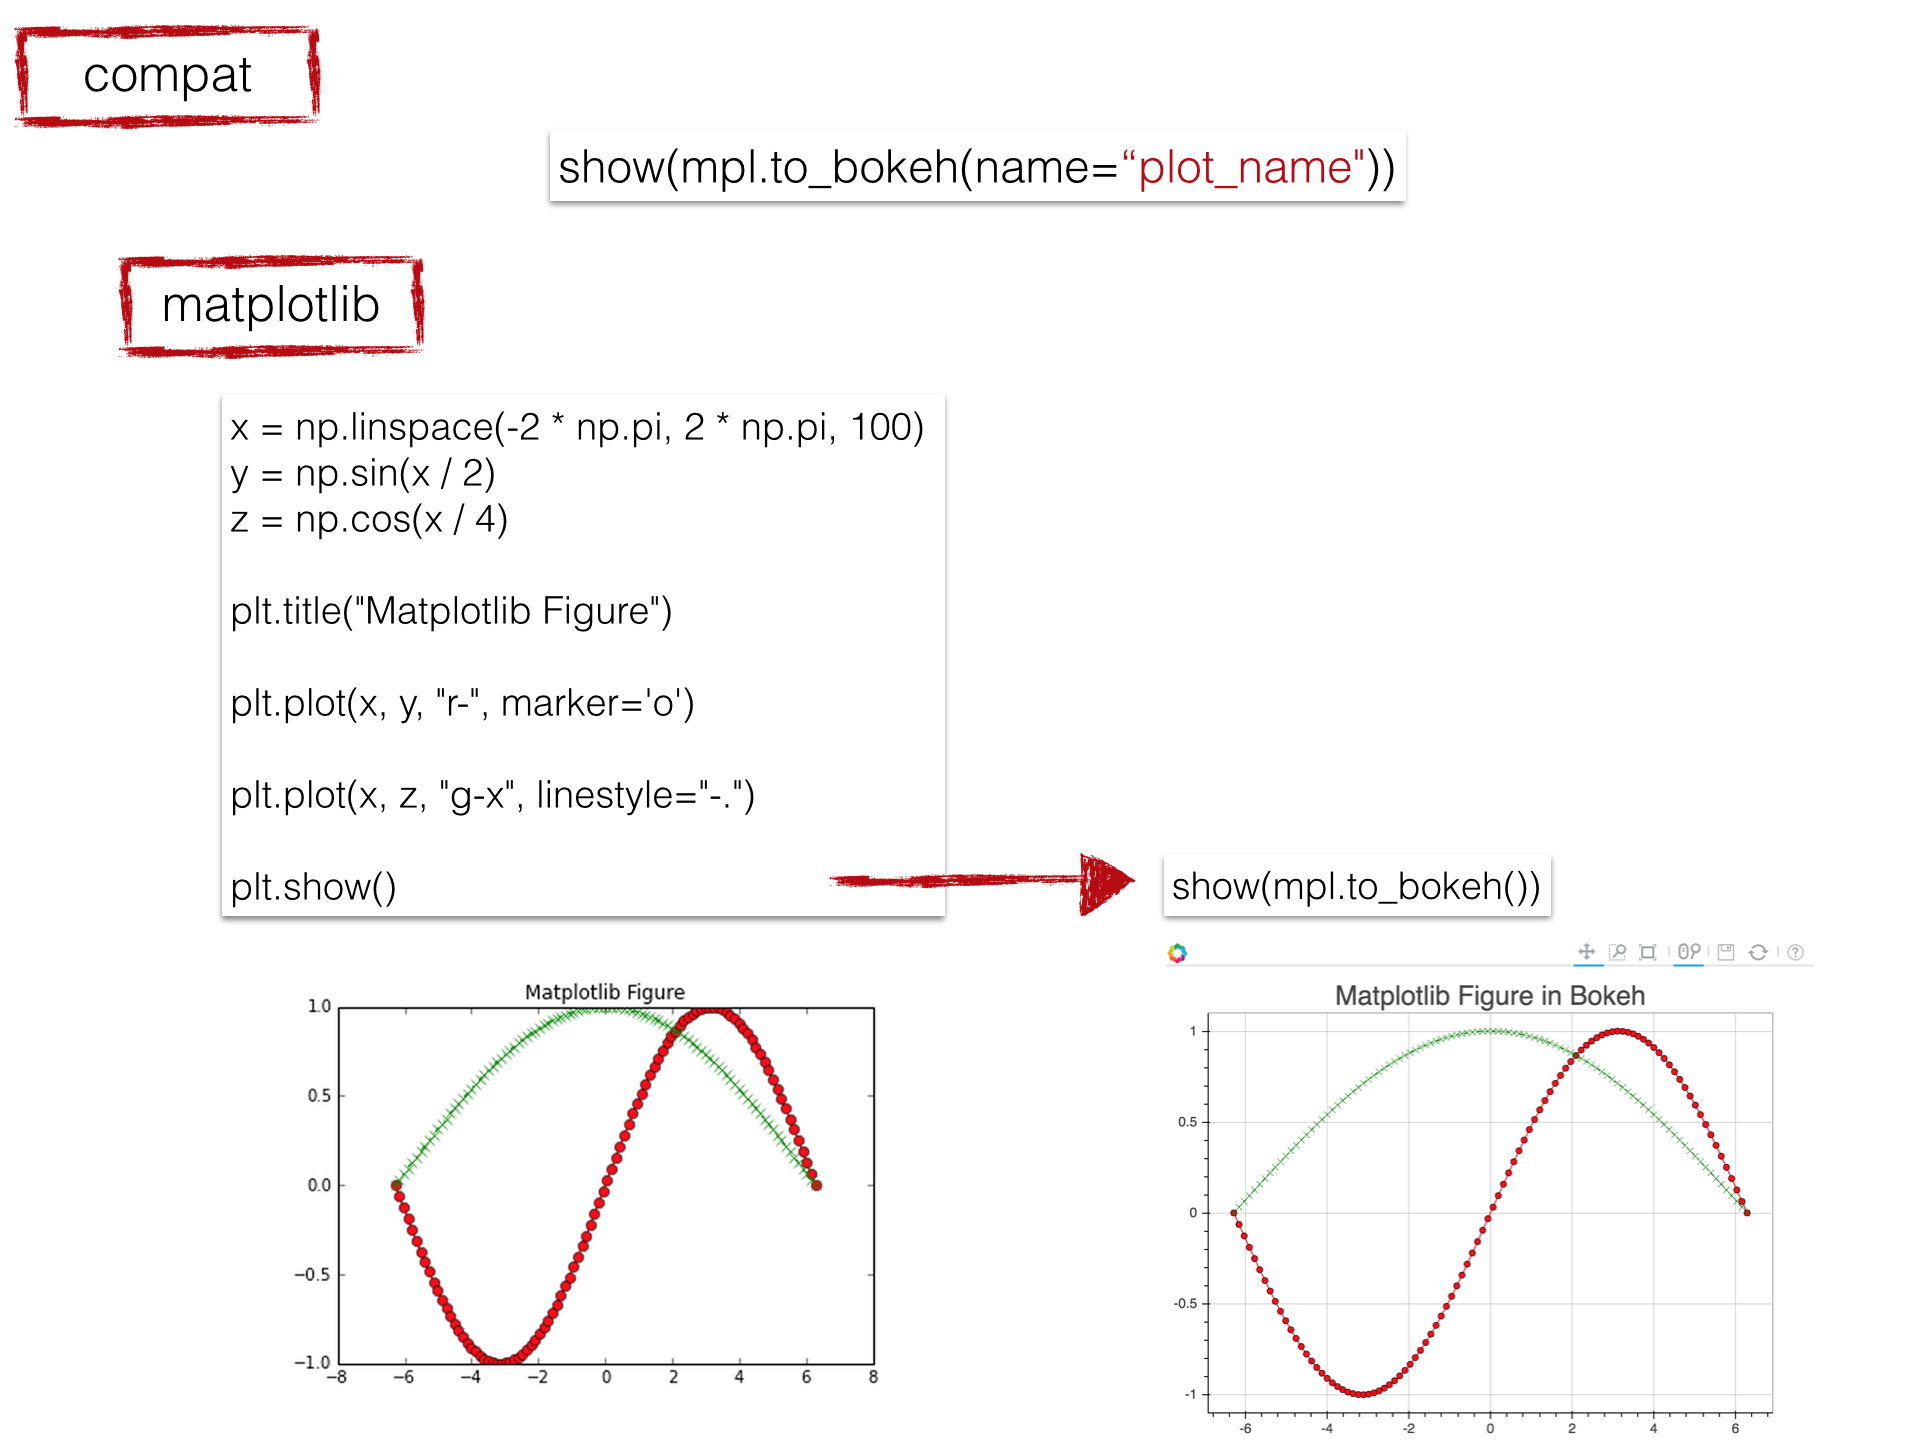
Compat
Resources
Bokeh Summary
Introduction to Blaze
Exercises
2. Blaze.ipynb
Final Exercise / Homework
Exercises
Create a Baseball application (Lahman dataset) with Blaze and Bokeh
Questions?
Slides:
http://chdoig.github.com/scipy2015-blaze-bokeh
Email: christine.doig@continuum.io
Twitter: ch_doig